
Trendline Liquidity
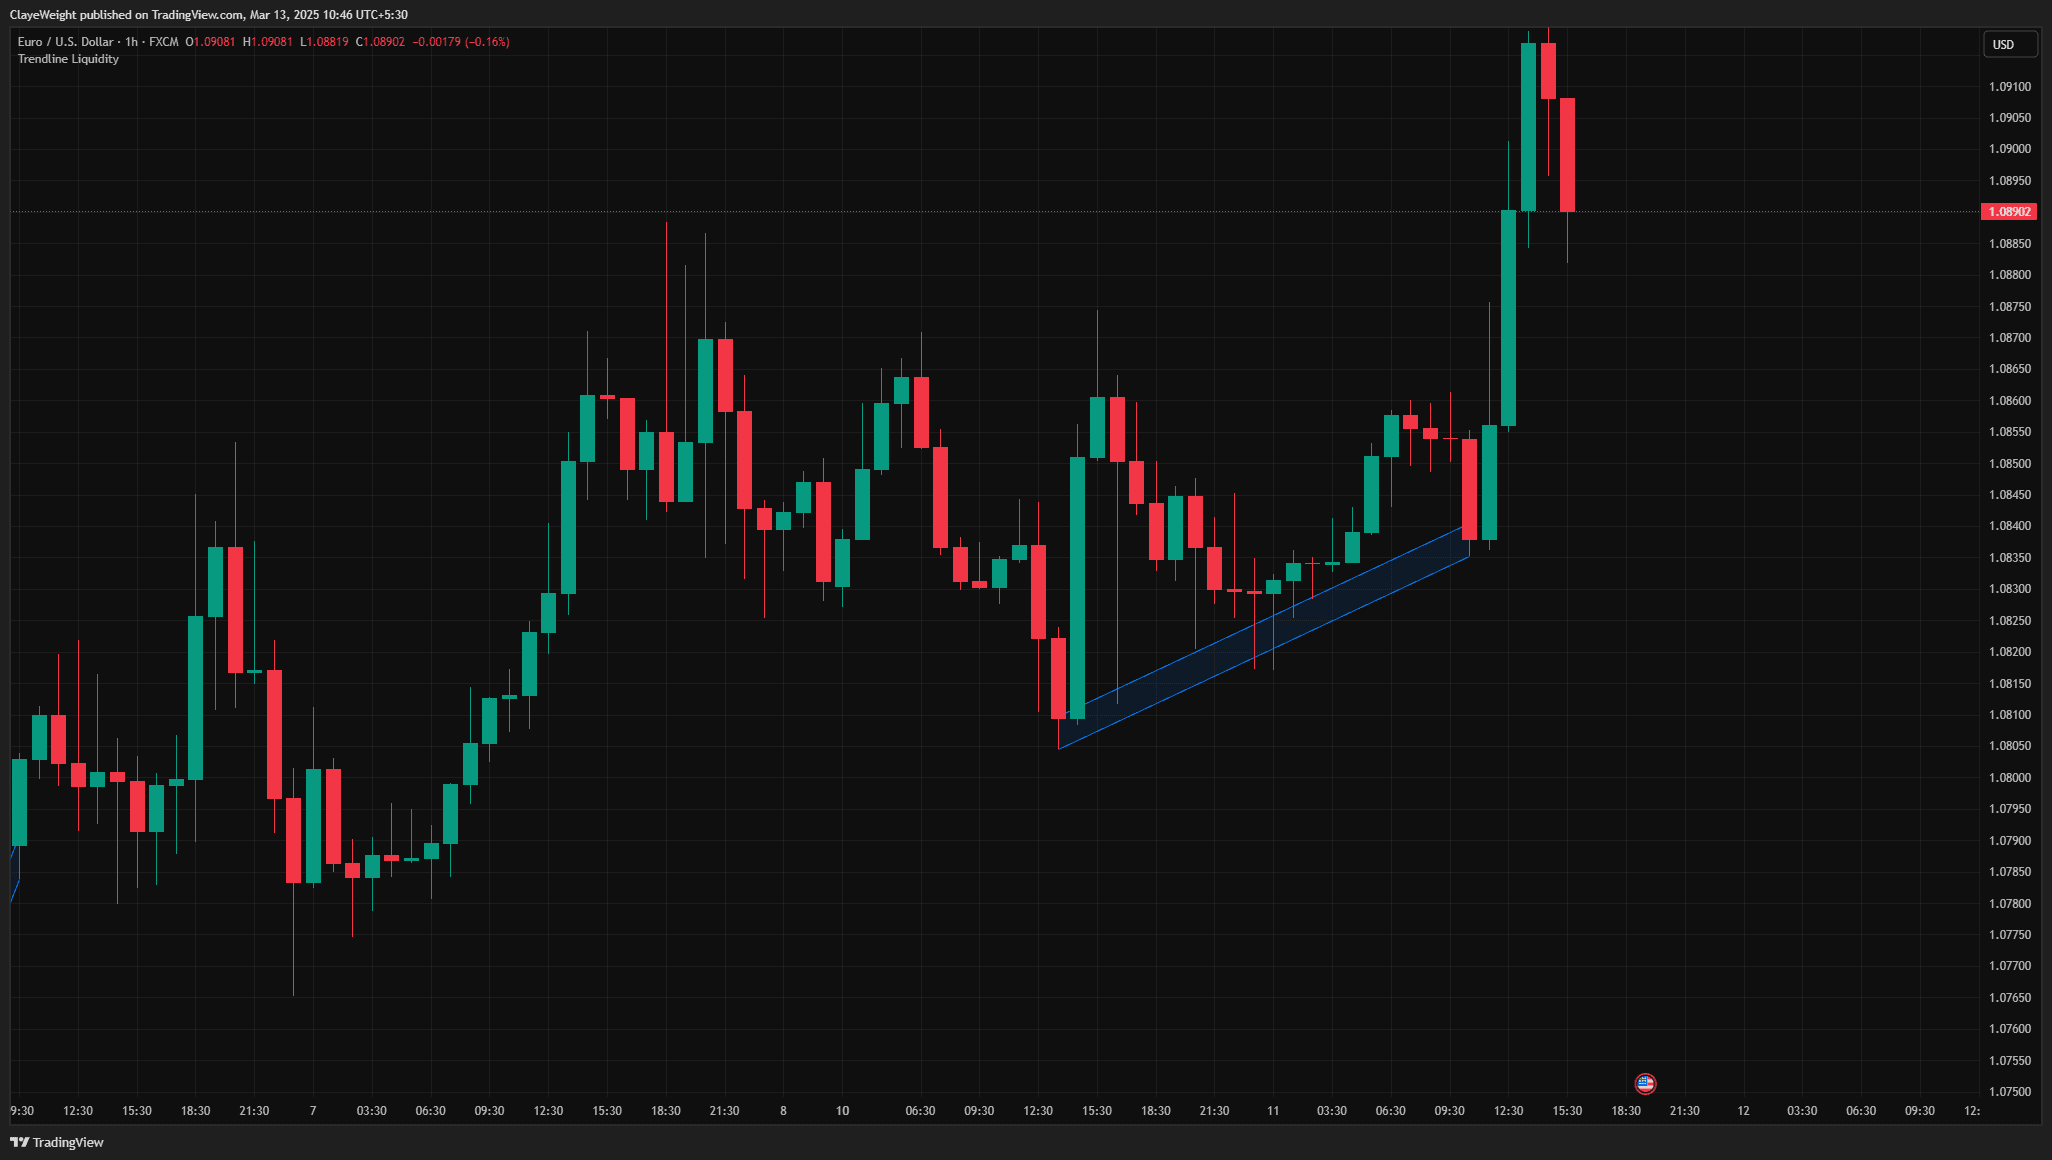
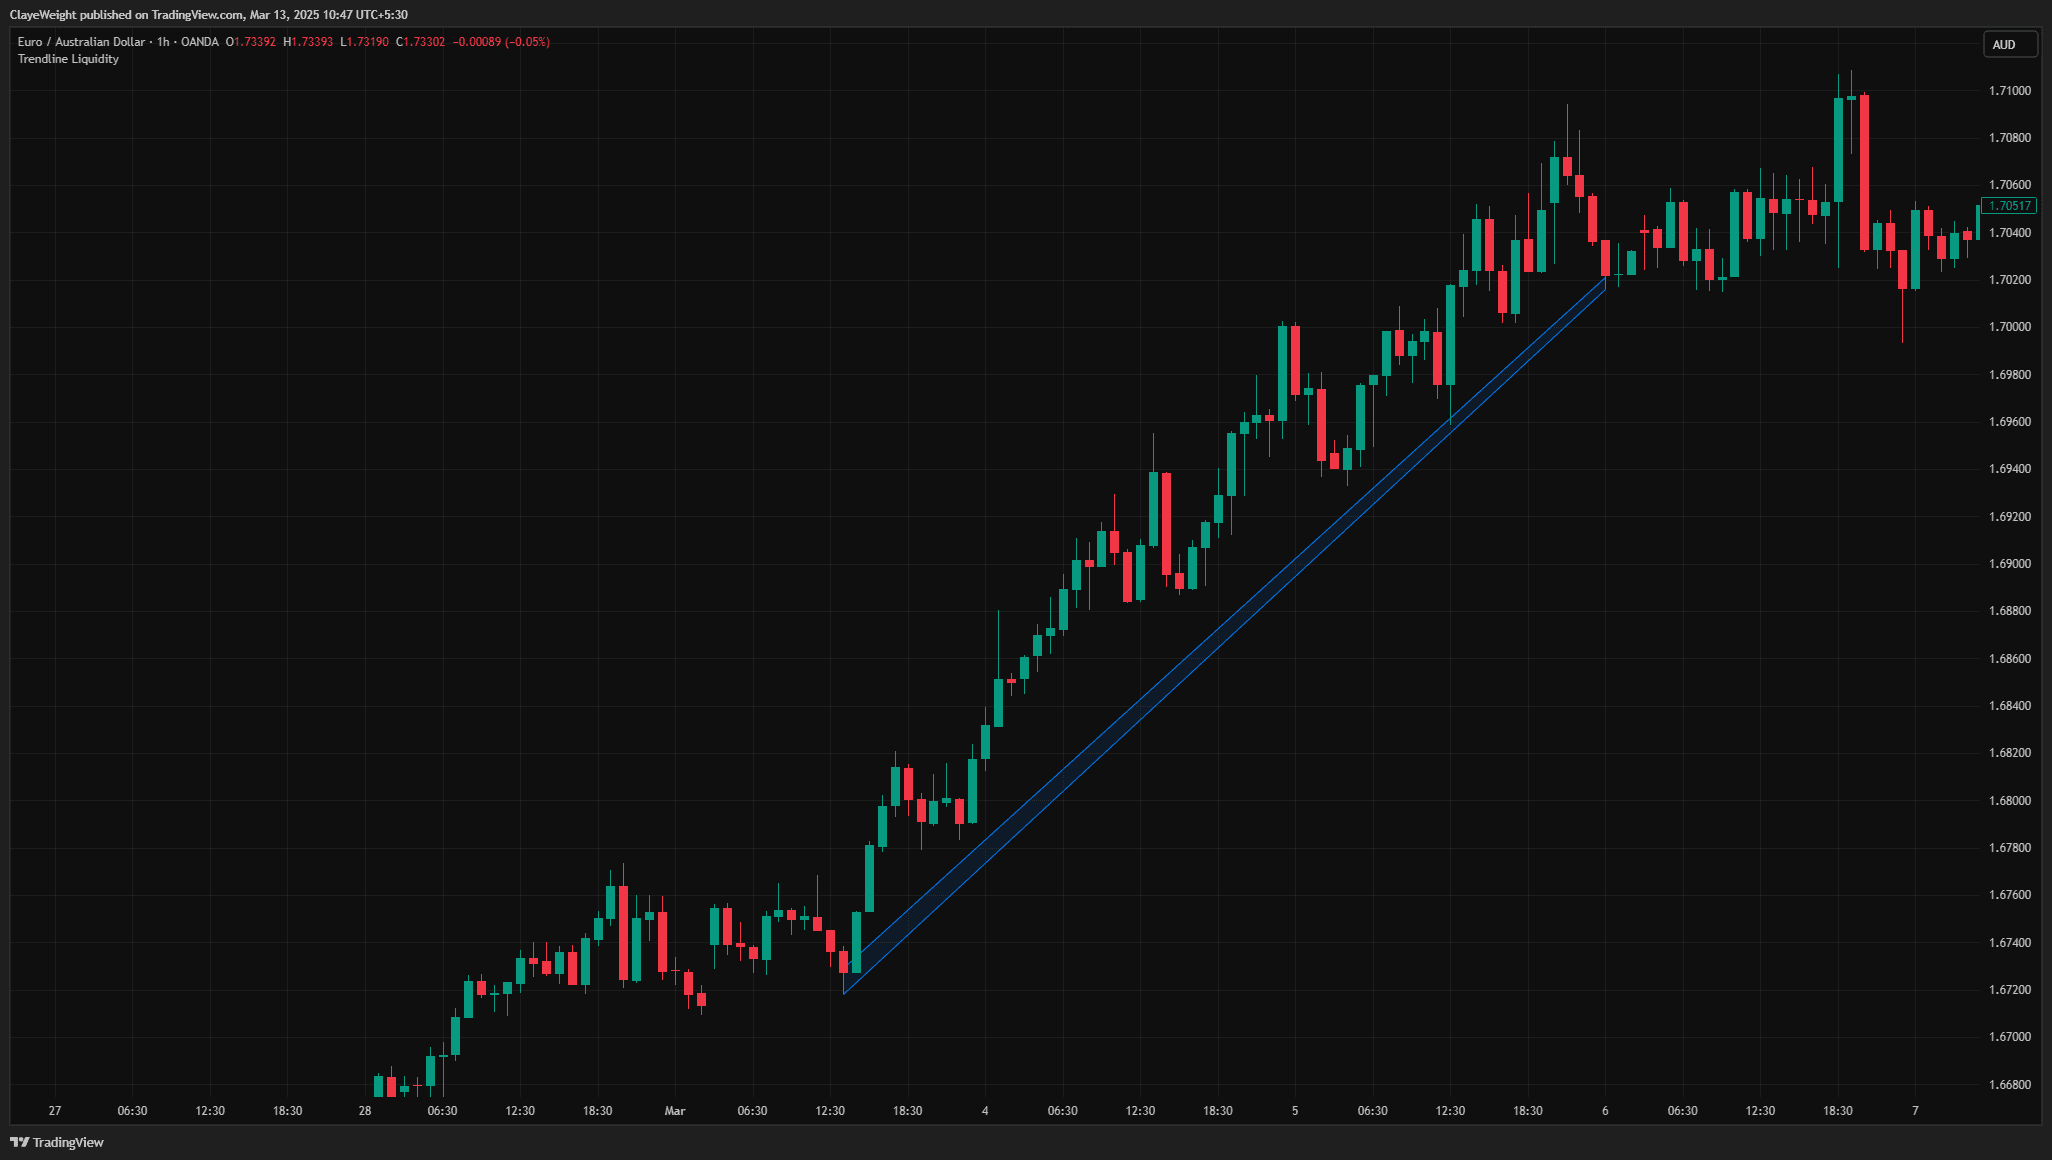
Draws significant trendlines automatically and shows where liquidity is building up along them. Smart money often sweeps this trendline liquidity before reversing—now you can see it coming.

What's Included
How Trendline Liquidity works
Trendlines connect a series of swing highs or swing lows to visualise the slope of a move. Because so many traders draw and watch the same obvious diagonals, protective stop orders tend to cluster just beyond them: buy stops above a descending trendline, sell stops below an ascending one. That cluster of resting orders is liquidity, and it sits in a predictable place.
Smart-money reasoning holds that large participants need liquidity to fill sizeable orders, so price is frequently drawn to where stops are pooled. A trendline break can therefore be a genuine shift in direction, or it can be a liquidity sweep: price pokes through the line, triggers the clustered stops, and then reverses back inside. Automatically drawn trendlines paired with the liquidity building along them help you distinguish the two.
In practice you watch how price behaves at the sweep. A clean break that holds and retests from the other side suggests continuation, whereas a sharp spike through the line followed by an immediate rejection back inside suggests the move was a stop raid before a reversal. Reading the reaction, not just the break, is the edge.
When to use it
- Trending markets with a clear diagonal that many participants are obviously watching and drawing.
- Anticipating stop hunts around a well-established trendline before committing to a breakout.
- Distinguishing a true trendline break from a false sweep by watching the reaction after the poke.
- Timing reversal entries when price sweeps trendline liquidity and rejects sharply back inside.
When it's not the right tool
- Choppy, directionless markets where no meaningful trendline can be drawn and liquidity is scattered.
- As a guarantee of reversal; sometimes a break is simply a break and the trend continues.
- Treating every trendline touch as a setup; the concept works best on clean, widely watched lines.
Source Code Preview
Get the full PineScript v6 source code—use it as a foundation and build on top of it with HorizonAI.
Frequently asked questions
Why does price so often reverse right after breaking a trendline?
Because stops cluster just beyond obvious trendlines, that zone holds concentrated liquidity. Larger participants can push price through to trigger those stops, fill their own orders against the resulting flow, and then reverse. Not every break is a sweep, but the pattern is common enough to watch for.
How do I tell a real breakout from a liquidity sweep?
Watch the follow-through. A genuine break tends to hold beyond the line and retest it as new support or resistance. A sweep spikes through, fails to hold, and snaps back inside quickly, often on a long wick. Confirmation on a lower timeframe can help.
Are automatically drawn trendlines better than my own?
Automated trendlines apply consistent rules and remove subjective bias, which helps you see the lines the broader market is likely watching. They are a starting point, not gospel; you can still refine them and, with HorizonAI, adjust how they are constructed to fit your approach.
Related Scripts
 Pro
ProMarket Structure
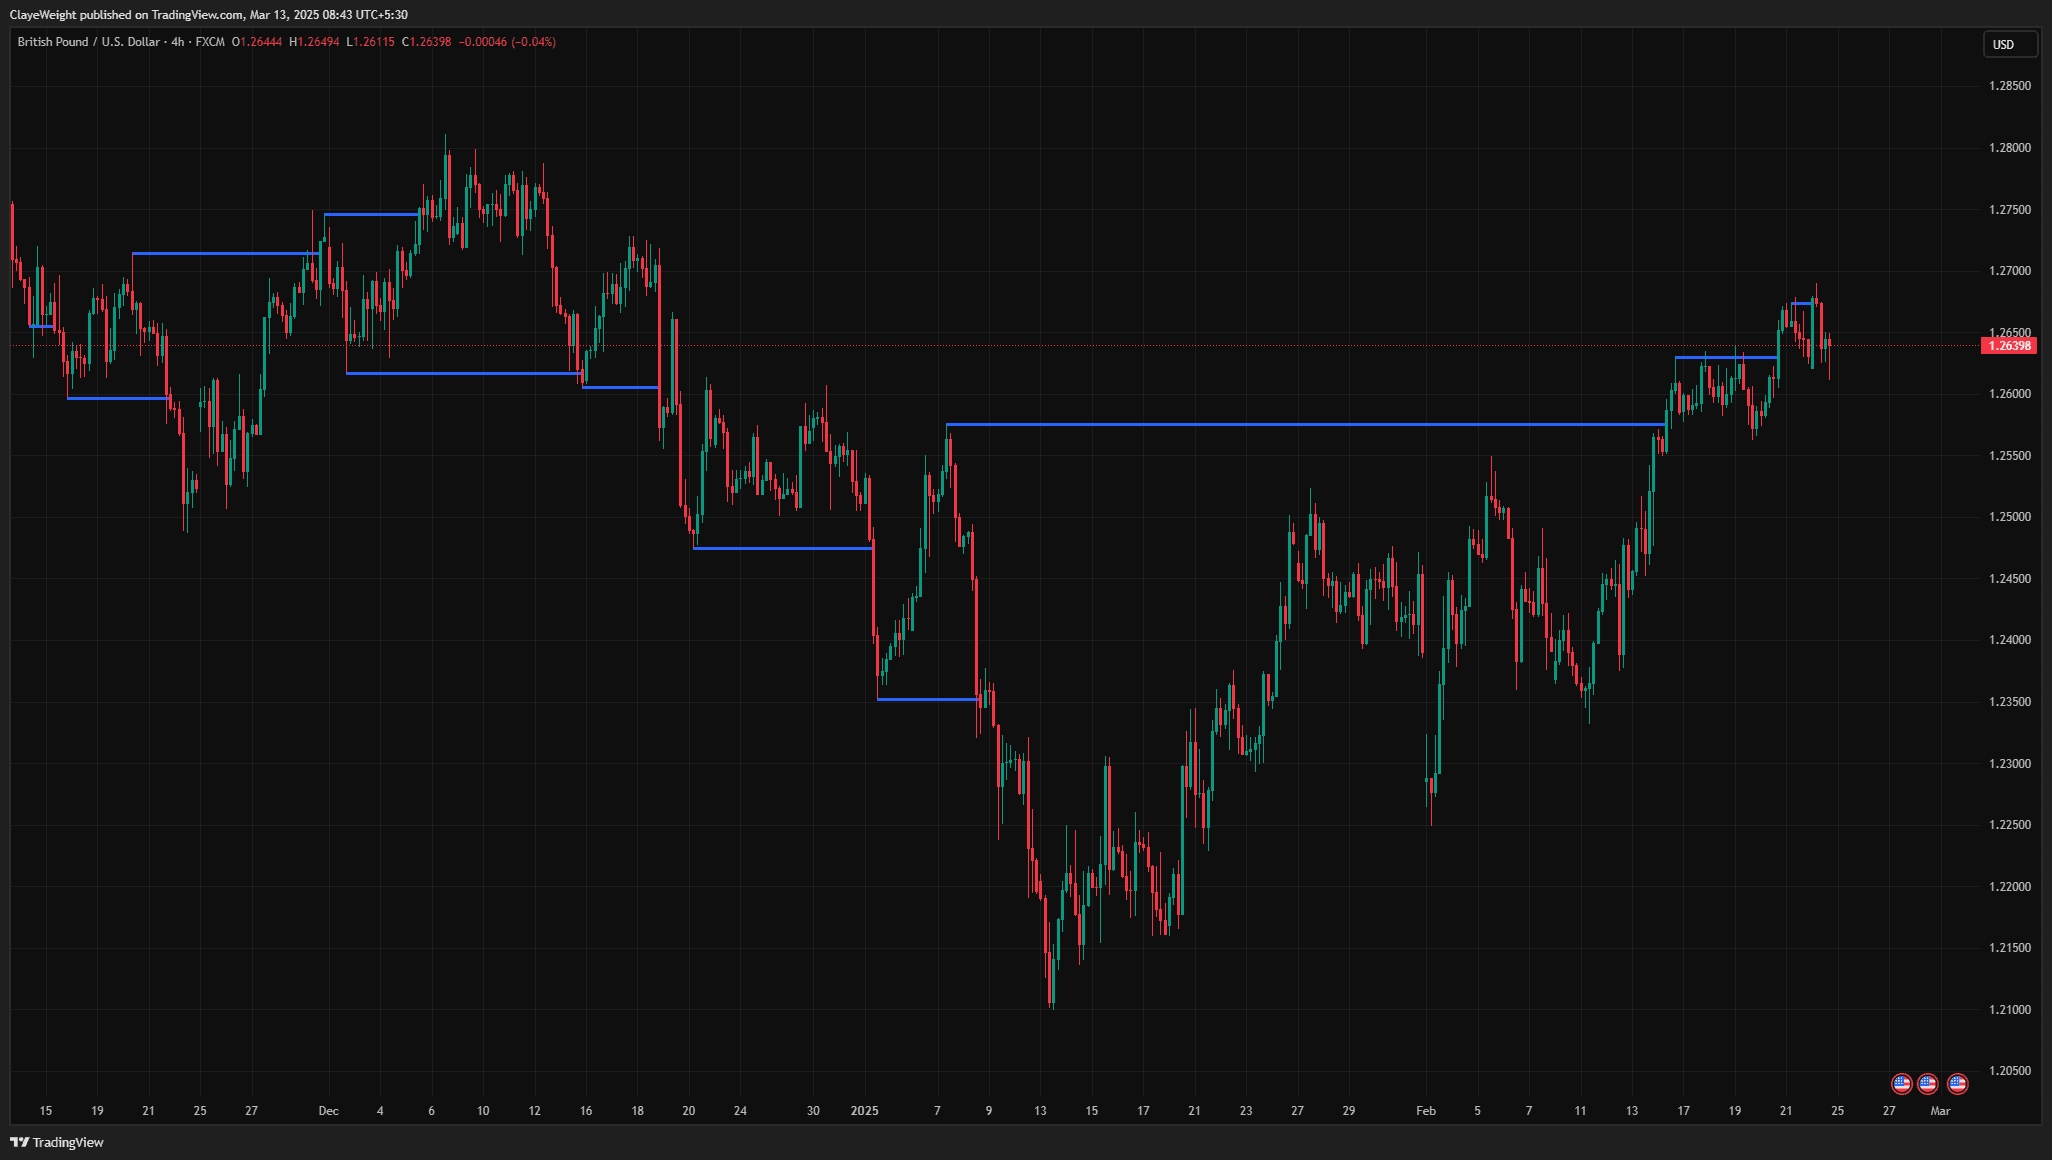
Automatically maps swing highs and lows with break of structure detection.
 Pro
ProSMC Market Structure Pro
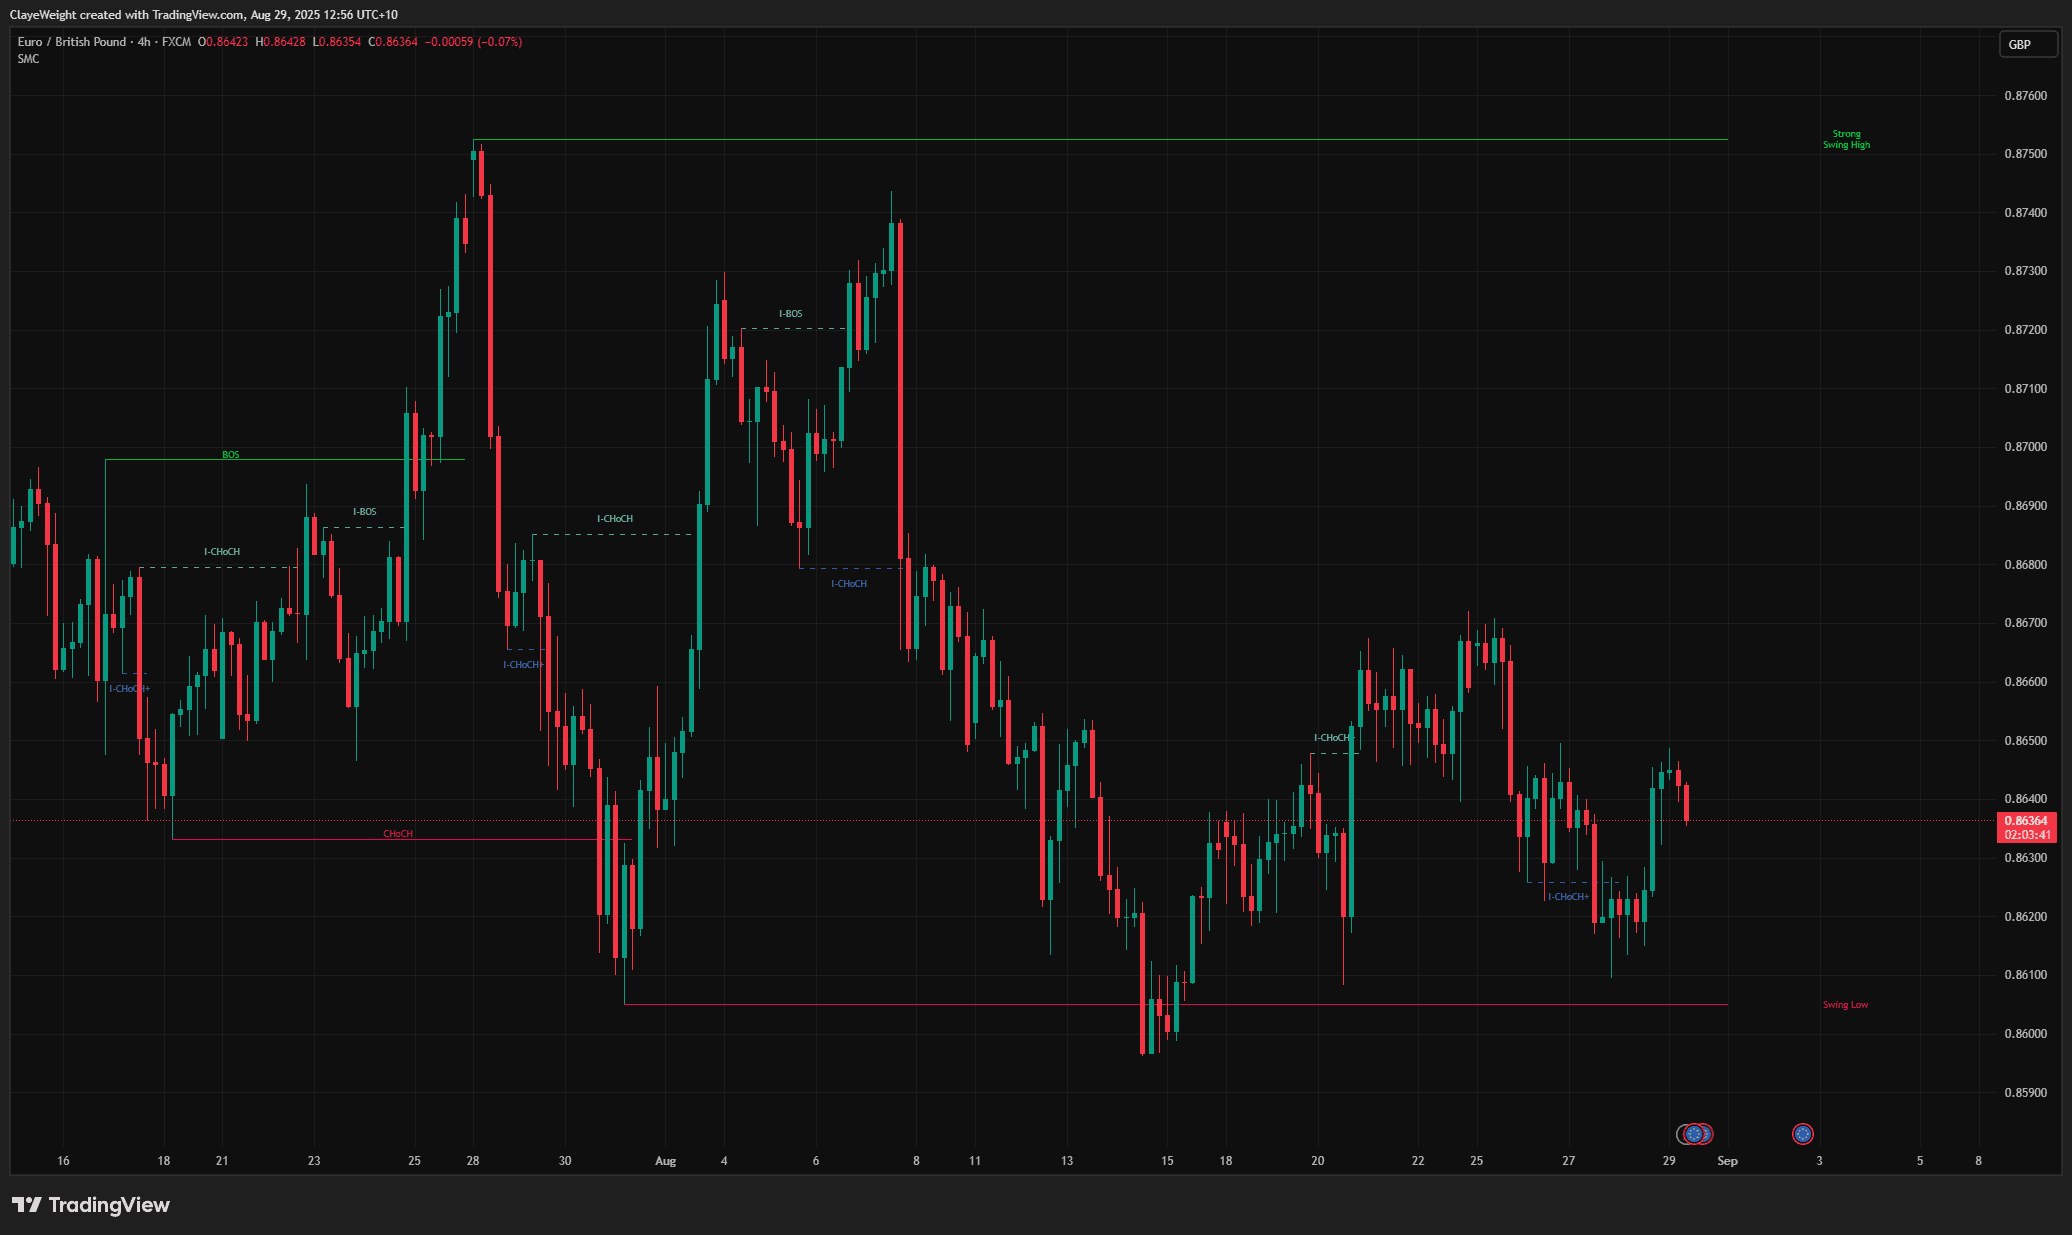
Advanced Smart Money Concepts with internal and swing structure mapping.
 Free
FreeAdvanced Order Blocks with Volume
A professional-grade indicator that combines order block detection with sophisticated volume analysis.
Get access to all 23+ scripts
Full source code, alert templates, and the perfect base to build on with HorizonAI. Join 10,000+ traders.