ICT Premium & Discount Zones (OTE): Auto-Plot in Pine Script v6
By HorizonAI Team · 13 min read · Intermediate
Most retail traders draw support and resistance like they're decorating a chart. ICT's premium and discount framework is different — it's a structured way to define where price is expensive, where it's cheap, and where the highest-probability entries cluster. Once you understand the logic, you can encode it into a Pine Script v6 indicator that auto-plots every level on any swing range, updates dynamically, and fires an alert the moment price enters the zone you care about.
This article covers the concept in enough depth to actually use it, then walks through production-quality Pine Script v6 code that detects swing highs and lows, draws the equilibrium line, shades premium and discount halves, fills the OTE band, and sends alerts. No hand-waving — real syntax, real parameters.
What You'll Learn
- What premium and discount zones are and how they relate to market structure
- Where the 50% equilibrium line sits and why it matters as a filter
- What the OTE zone is (0.62–0.79 Fibonacci retracement) and how ICT traders use it
- How to detect swing highs and lows automatically with
ta.pivothigh/ta.pivotlow - How to draw dynamic boxes, lines, and fills that update as price moves
- How to add price-entry alerts to the OTE zone
- How to apply a higher-timeframe bias filter so you're only trading in the right direction
Premium vs. Discount: The Core Concept
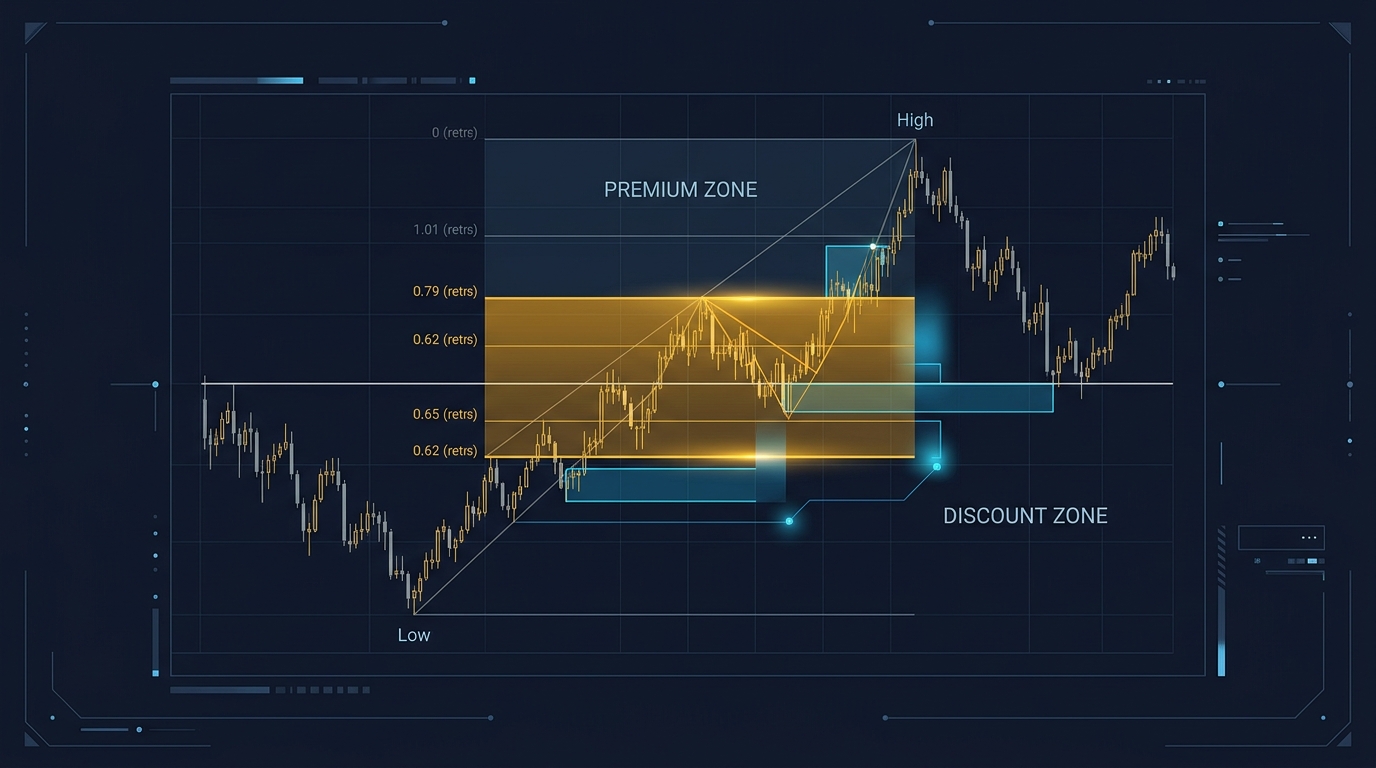
Take any defined swing range — a swing low to a swing high. Premium is the upper half of that range (above the 50% midpoint). Discount is the lower half (below the 50% midpoint).
The logic is straightforward: if you're a buyer, you want to buy cheap, so you buy in discount. If you're a seller, you want to sell expensive, so you sell in premium. ICT frames this as smart money positioning — institutions accumulate longs in discount and distribute into premium, then reverse the process.
This isn't just a philosophical label. It gives you a directional filter for every setup:
- Bullish bias (higher-timeframe trend up) → only look for longs in the discount zone
- Bearish bias (higher-timeframe trend down) → only look for shorts in the premium zone
Trading against the zone — buying in premium during a bullish trend, for example — isn't automatically wrong, but it's a lower-probability play that requires additional confluence. The framework is a filter, not a guarantee.
The 50% Equilibrium Line
The midpoint of any swing range is called the equilibrium (EQ). At 50% retracement, price is neither premium nor discount — it's fair value. ICT traders treat this level with respect:
- Price reacting at EQ and reversing confirms the range is still valid
- Price slicing through EQ with momentum signals potential range expansion or a shift in structure
- EQ acts as a magnet — price often consolidates around it before committing to premium or discount
In code, EQ is trivial to calculate: eq = swingLow + (swingHigh - swingLow) * 0.5. The harder part is detecting the swing high and low automatically, which we'll handle with pivot detection.
The OTE Zone: 0.62 to 0.79 Fibonacci
OTE stands for Optimal Trade Entry. It's the band between the 0.62 and 0.79 Fibonacci retracement levels of a swing move. ICT uses this zone as the primary entry window after a displacement move — price runs from a swing low to a swing high (or vice versa), then retraces back into the 0.62–0.79 band before continuing in the original direction.
Why this specific band? The 0.618 level is the classic golden ratio retracement. The 0.79 level (sometimes cited as 0.786 in standard Fibonacci sets) marks the deepest acceptable pullback before the swing structure is compromised. Together, they define a zone where:
- Price has retraced enough to offer value
- Price hasn't retraced so much that the original move is invalidated
- Stop losses can be placed just beyond the swing extreme with a favorable risk/reward
For a bullish OTE (buying a pullback in an uptrend):
- Swing Low → Swing High defines the range
- OTE sits between 0.62 and 0.79 retracement from the swing high back toward the swing low
- Entry: price enters the OTE band
- Stop: below the swing low
- Target: swing high or beyond (typically 2R–4R)
For a bearish OTE (selling a pullback in a downtrend):
- Swing High → Swing Low defines the range
- OTE sits between 0.62 and 0.79 retracement from the swing low back toward the swing high
- Entry: price enters the OTE band
- Stop: above the swing high
The OTE is a discount entry in a bullish range and a premium entry in a bearish range — it combines both frameworks into one precise zone.
Pro Tip: OTE setups have the highest hit rate when the retracement into the zone coincides with a Fair Value Gap (FVG) or an order block on the same timeframe. The zone gives you the where; the microstructure gives you the when.
Detecting Swing Highs and Lows Automatically
Pine Script v6's ta.pivothigh() and ta.pivotlow() functions scan left and right bars to identify local extremes. The key parameter is the lookback length — how many bars on each side must be lower (for a high) or higher (for a low) to qualify.
//@version=6
indicator("ICT Premium / Discount / OTE Zones", overlay=true, max_lines_count=20, max_boxes_count=10, max_labels_count=10)

// ─── Inputs ───────────────────────────────────────────────────────────────────
swingLen    = input.int(10,  "Swing Lookback (bars each side)", minval=3, maxval=50)
oteHigh     = input.float(0.79, "OTE Upper Level",  minval=0.5, maxval=1.0, step=0.01)
oteLow      = input.float(0.62, "OTE Lower Level",  minval=0.0, maxval=0.99, step=0.01)
showEQ      = input.bool(true,  "Show Equilibrium Line")
showBoxes   = input.bool(true,  "Show Premium / Discount Boxes")
bullColor   = input.color(color.new(color.teal,  80), "Discount (Bull) Color")
bearColor   = input.color(color.new(color.red,   80), "Premium  (Bear) Color")
oteColor    = input.color(color.new(color.orange, 60), "OTE Zone Color")

// ─── Pivot Detection ──────────────────────────────────────────────────────────
// ta.pivothigh/pivotlow return the value at the pivot bar, or na if no pivot
rawHigh = ta.pivothigh(high, swingLen, swingLen)
rawLow  = ta.pivotlow (low,  swingLen, swingLen)

// Track the most recent confirmed swing high and low
var float swingHigh     = na
var int   swingHighBar  = na
var float swingLow      = na
var int   swingLowBar   = na

if not na(rawHigh)
    swingHigh    := rawHigh
    swingHighBar := bar_index[swingLen]  // pivot occurred swingLen bars ago

if not na(rawLow)
    swingLow    := rawLow
    swingLowBar := bar_index[swingLen]
Note the bar_index[swingLen] offset. Because ta.pivothigh confirms a pivot only after swingLen bars have printed to the right, the actual pivot bar is swingLen bars in the past. Getting this right is critical for accurate level placement.
Calculating All Key Levels
With the swing high and low tracked, every level is a simple interpolation:
// ─── Level Calculations ───────────────────────────────────────────────────────
// Only calculate when both pivots are defined
validRange = not na(swingHigh) and not na(swingLow) and swingHigh != swingLow

rangeSize   = validRange ? swingHigh - swingLow : na
eqLevel     = validRange ? swingLow + rangeSize * 0.5  : na  // 50% equilibrium

// OTE retracement levels (measured from the HIGH, pulling back toward the LOW)
// For a bullish range: 0.62 retracement = high - 0.62 * range
oteUpperLevel = validRange ? swingHigh - rangeSize * oteLow  : na  // 0.62 from high
oteLowerLevel = validRange ? swingHigh - rangeSize * oteHigh : na  // 0.79 from high

// Fib 0.5 (EQ), 0.62, 0.79 labels for reference
fib236 = validRange ? swingHigh - rangeSize * 0.236 : na
fib705 = validRange ? swingHigh - rangeSize * 0.705 : na  // midpoint of OTE band
The OTE levels are calculated as retracements from the swing high. For a bullish setup, you want price to pull back from the high into the 0.62–0.79 band. The formula swingHigh - rangeSize * 0.62 gives you the 0.62 retracement level measured from the high.
Drawing the Zones Dynamically
This is where the indicator gets visual. We'll use box.new() for the premium and discount regions, a line.new() for EQ, and linefill.new() for the OTE shading. Because we want these to extend to the right edge of the chart, we use extend.right.
// ─── Drawing (runs only when range is valid) ──────────────────────────────────
var box   premiumBox  = na
var box   discountBox = na
var line  eqLine      = na
var box   oteBox      = na

// Determine the left anchor bar (whichever pivot is older)
leftBar = validRange ? math.min(swingHighBar, swingLowBar) : na

if validRange and barstate.islast
    // Delete previous drawings before redrawing
    box.delete(premiumBox)
    box.delete(discountBox)
    line.delete(eqLine)
    box.delete(oteBox)

    rightBar = bar_index + 20  // extend 20 bars into the future

    // Premium box: EQ → Swing High
    if showBoxes
        premiumBox  := box.new(
             left         = leftBar,
             top          = swingHigh,
             right        = rightBar,
             bottom       = eqLevel,
             border_color = color.new(color.red,  50),
             bgcolor      = bearColor,
             extend       = extend.right
         )

        // Discount box: Swing Low → EQ
        discountBox := box.new(
             left         = leftBar,
             top          = eqLevel,
             right        = rightBar,
             bottom       = swingLow,
             border_color = color.new(color.teal, 50),
             bgcolor      = bullColor,
             extend       = extend.right
         )

    // Equilibrium line
    if showEQ
        eqLine := line.new(
             x1    = leftBar,
             y1    = eqLevel,
             x2    = rightBar,
             y2    = eqLevel,
             color = color.white,
             width = 1,
             style = line.style_dashed,
             extend = extend.right
         )

    // OTE zone box
    oteBox := box.new(
         left         = leftBar,
         top          = oteUpperLevel,
         right        = rightBar,
         bottom       = oteUpperLevel,  // will set bottom below
         border_color = color.new(color.orange, 30),
         bgcolor      = oteColor,
         extend       = extend.right
     )
    // Correct the bottom after creation
    box.set_bottom(oteBox, oteUpperLevel)
    box.set_top(oteBox, oteUpperLevel)
    // Rebuild with correct top/bottom
    box.delete(oteBox)
    oteBox := box.new(
         left         = leftBar,
         top          = oteUpperLevel,
         right        = rightBar,
         bottom       = oteLowerLevel,
         border_color = color.new(color.orange, 30),
         bgcolor      = oteColor,
         extend       = extend.right
     )

// ─── Labels for key levels ────────────────────────────────────────────────────
if validRange and barstate.islast
    label.new(bar_index + 21, swingHigh,    "HH: " + str.tostring(swingHigh,    format.mintick), style=label.style_label_left, color=color.new(color.red,   70), textcolor=color.white, size=size.small)
    label.new(bar_index + 21, eqLevel,      "EQ 50%: " + str.tostring(eqLevel,  format.mintick), style=label.style_label_left, color=color.new(color.gray,  70), textcolor=color.white, size=size.small)
    label.new(bar_index + 21, oteUpperLevel,"OTE 62%: " + str.tostring(oteUpperLevel, format.mintick), style=label.style_label_left, color=color.new(color.orange,70), textcolor=color.white, size=size.small)
    label.new(bar_index + 21, oteLowerLevel,"OTE 79%: " + str.tostring(oteLowerLevel, format.mintick), style=label.style_label_left, color=color.new(color.orange,70), textcolor=color.white, size=size.small)
    label.new(bar_index + 21, swingLow,     "LL: " + str.tostring(swingLow,     format.mintick), style=label.style_label_left, color=color.new(color.teal,  70), textcolor=color.white, size=size.small)
Note: In Pine Script v6,
box.new()requirestop > bottom. Always verifyoteUpperLevel > oteLowerLevelbefore drawing — if the swing range is inverted (bearish OTE), swap the calculation accordingly.
Adding OTE Entry Alerts
The indicator is only useful if you know when price actually enters the zone. Pine Script's alertcondition() handles this cleanly:
// ─── Alert Conditions ─────────────────────────────────────────────────────────
// Price enters the OTE zone from above (bullish pullback scenario)
inOTE = validRange and close <= oteUpperLevel and close >= oteLowerLevel

// Detect the first bar entering the zone (edge trigger, not level trigger)
enteredOTE = inOTE and not inOTE[1]

alertcondition(
     enteredOTE,
     title   = "Price Entered OTE Zone",
     message = "{{ticker}} entered the OTE zone (0.62–0.79 retracement). Current price: {{close}}"
 )

// Visual: highlight bars inside OTE
bgcolor(inOTE ? color.new(color.orange, 85) : na, title="OTE Bar Highlight")
Set the alert in TradingView using "Once Per Bar Close" to avoid noise from intrabar wicks. "Once Per Bar" works if you want the earliest possible notification.
If you want to build a full alert system with multiple conditions — OTE entry plus a bullish engulfing candle, for example — check out the approach in Automate a Supertrend Strategy with Alerts in Pine Script v6, which covers multi-condition alertcondition chaining in detail.
Applying a Higher-Timeframe Bias Filter
The OTE zone tells you where to look for entries. The higher-timeframe trend tells you which direction to trade. Without this filter, you'll take both bullish and bearish OTE setups indiscriminately — and in trending markets, one side will consistently lose.
The standard approach is to use the 200 EMA on a higher timeframe as the bias filter:
// ─── Higher-Timeframe Bias Filter ─────────────────────────────────────────────
htfTF       = input.timeframe("D", "Higher Timeframe for Bias")
htfClose    = request.security(syminfo.tickerid, htfTF, close)
htfEMA200   = request.security(syminfo.tickerid, htfTF, ta.ema(close, 200))

bullishBias = htfClose > htfEMA200  // price above daily 200 EMA → bullish bias
bearishBias = htfClose < htfEMA200  // price below daily 200 EMA → bearish bias

// Plot bias indicator in a pane or as a background tint
bgcolor(
     bullishBias ? color.new(color.teal, 97) :
     bearishBias ? color.new(color.red,  97) : na,
     title = "HTF Bias Background"
 )

// Filtered alert: only fire OTE alert when bias aligns
bullOTE = enteredOTE and bullishBias
bearOTE = enteredOTE and bearishBias

alertcondition(bullOTE, title="Bullish OTE Entry", message="{{ticker}} bullish OTE entry confirmed. HTF bias: bullish. Price: {{close}}")
alertcondition(bearOTE, title="Bearish OTE Entry",  message="{{ticker}} bearish OTE entry confirmed. HTF bias: bearish. Price: {{close}}")
With this filter active, you get separate alerts for bullish and bearish OTE setups, each pre-validated against the daily trend. On a 15-minute chart with a daily bias filter, this setup works well on EUR/USD, GBP/USD, NAS100, and ES futures — instruments with clean swing structure and sufficient liquidity.
For understanding how break-and-retest setups interact with these zones, the Break and Retest Strategy guide is worth reading alongside this — OTE entries frequently occur right after a structural break and retest sequence.
Common Mistakes When Trading OTE Zones
❌ Mistake: Using too short a pivot lookback (swingLen = 3–5)
With a short lookback, you'll detect dozens of minor pivots and redraw the range constantly. The OTE zone becomes meaningless noise.
✅ Do This: Use swingLen = 10 on the 15-minute chart, swingLen = 8 on the 1-hour chart. You want the most significant recent swing, not every minor fluctuation.
❌ Mistake: Entering the moment price touches the 0.62 level The OTE is a zone, not a line. Price can wick through 0.62, reverse, re-enter, and only then commit. Entering on the first touch leads to getting stopped out by normal wick behavior. ✅ Do This: Wait for a bar close inside the OTE zone, then look for a confirmation signal — a bullish/bearish engulfing candle, a Fair Value Gap fill, or a 1-minute order block. Enter on the next bar open.
❌ Mistake: Trading OTE setups against the higher-timeframe trend If the daily chart is in a strong downtrend and you're taking bullish OTE setups on the 15-minute chart, you're fighting institutional order flow. ✅ Do This: Enable the HTF bias filter. In a downtrend, only take bearish OTE setups (price retracing into premium, then selling off). Bullish OTE setups in a downtrend require multiple layers of confluence to justify.
❌ Mistake: Forgetting to account for the bearish OTE direction
The code above calculates OTE as a bullish retracement (from swing high back toward swing low). For a bearish OTE (price rallying back into the premium zone after a swing low to swing high move down), the math inverts.
✅ Do This: Add a biasMode input ("Bullish" / "Bearish" / "Auto") and flip the OTE level calculations based on the selected mode. In "Auto" mode, use the HTF bias to determine direction.
❌ Mistake: Plotting boxes without deleting old ones
In Pine Script, if you create new drawings every bar without deleting previous ones, you'll hit the max_boxes_count limit quickly and the script will throw a runtime error.
✅ Do This: Always pair box.new() with box.delete() on the previous reference, and wrap redraws inside barstate.islast so they only execute on the current bar.
Pro Tips for Production Use
Tip 1: Multi-timeframe OTE stacking. Plot OTE zones from two timeframes simultaneously — the 4-hour and 15-minute, for example. When both zones overlap at the same price, confluence is strong. You can do this by calling request.security() to pull higher-timeframe pivot values and drawing a second set of boxes in a lighter color.
Tip 2: Track whether price has already visited the OTE. Add a var bool oteVisited = false flag that sets to true when price first enters the zone. Once visited, the setup is consumed — don't re-enter the same zone on a second touch without a new swing forming.
Tip 3: Combine with session filters. OTE setups during the London and New York sessions (02:00–05:00 EST and 08:30–11:00 EST) have significantly better follow-through than setups that form during the Asian session. Add a session-time filter to your alert conditions.
Tip 4: Log OTE touches to a table. Pine Script v6's table object lets you display a running count of OTE touches and whether they resulted in continuation. This gives you a live win-rate tracker directly on the chart — useful for validating the setup across different instruments before committing real capital.
Build the Full System with HorizonAI
The code above handles the core OTE plotting and alerting. But extending it into a full strategy — with position sizing, dynamic stop placement at the swing extreme, and take-profit at the opposing swing level — requires more logic. That's where HorizonAI accelerates the build.
Here are specific prompts you can use in HorizonAI to extend this indicator:
Prompt 1: "Build a Pine Script v6 strategy that enters long when price closes inside the 0.62–0.79 OTE zone of the most recent swing (10-bar pivot lookback), places a stop-loss 5 ticks below the swing low, and targets the swing high. Only take trades when price is above the daily 200 EMA. Include position sizing based on 1% account risk."
Prompt 2: "Add a bearish OTE mode to my existing Pine Script indicator. When HTF bias is bearish, flip the OTE calculation so it measures retracement from the swing low back toward the swing high (0.62–0.79 of the range). Draw the OTE box in red instead of orange and fire a separate bearish alert."
Prompt 3: "Convert this Pine Script OTE indicator to MQL5 for MetaTrader 5. Auto-detect the most recent 10-bar swing high and low, draw horizontal lines at the 50%, 62%, and 79% levels, and send a push notification when price enters the 62–79% zone."
FAQs
What's the difference between OTE and a standard Fibonacci retracement?
A standard Fibonacci retracement plots all levels (0.236, 0.382, 0.5, 0.618, 0.786, 1.0) and leaves the trader to decide which ones matter. OTE is a specific application of Fibonacci — ICT defines the 0.62–0.79 band as the primary entry window and ignores the other levels for entry purposes. It's an opinionated subset, not a different tool.
Which timeframes work best for OTE setups?
The setup works on any timeframe, but the cleanest setups appear on the 15-minute, 1-hour, and 4-hour charts. On the 15-minute chart, use a daily or 4-hour bias filter. On the 4-hour chart, use the weekly chart as your bias reference. Very short timeframes (1-minute, 5-minute) generate too many pivots and the zones repaint too frequently to be actionable.
How do I know when the OTE setup is invalidated?
The setup is invalidated when price closes below the swing low (for a bullish OTE) or above the swing high (for a bearish OTE). A close beyond the swing extreme means the range that defined the OTE is broken, and a new swing needs to form before the setup is valid again. Your stop-loss should sit just beyond this level.
Can I use OTE zones on crypto markets?
Yes, but crypto's 24/7 structure means swing highs and lows form at all hours, including low-liquidity periods. Filter your setups to the New York and London sessions even on crypto charts — swings that form during these windows tend to produce cleaner OTE reactions. Bitcoin and Ethereum on the 1-hour chart with a 10-bar pivot lookback work well.
Why does my Pine Script indicator repaint the zones?
Repainting happens when ta.pivothigh / ta.pivotlow confirm pivots that shift on historical bars as new data arrives. The fix is to only update swingHigh and swingLow when a new pivot is confirmed (using the var keyword to persist values across bars) and to never reference bar_index[0] for pivot placement. The code in this article uses bar_index[swingLen] for correct historical placement.
Final Thoughts
Premium and discount zones are a clean mental model for reading where price is relative to a defined range — and the OTE band gives you a precise entry window within that model. The real edge isn't in knowing the concept; it's in having an indicator that auto-plots every level across every instrument you trade, fires an alert the moment price enters your zone, and filters setups by higher-timeframe bias so you're not fighting the trend.
The code in this article is production-ready. Drop it into TradingView, set swingLen = 10, enable the daily bias filter, and run it on a few weeks of EUR/USD or NAS100 data. Watch how often the 0.62–0.79 band holds as a reversal zone on the first touch during a trending session. Once you see it, you won't look at retracements the same way again.
Related Articles
- Break and Retest Strategy — The Complete Trading Guide — Understand how structural breaks interact with premium/discount zones and where OTE entries often form post-retest
- Automate a Supertrend Strategy with Alerts in Pine Script v6 — Learn multi-condition alert chaining and strategy automation patterns that extend naturally to OTE systems
- Simple Moving Average Crossover Strategy: Complete Guide — Build the EMA bias filter foundation that pairs with OTE zone entries for trend-aligned setups
Questions about ICT premium/discount zones or Pine Script implementation? Join our Discord to discuss with other traders!