Break and Retest Strategy — The Complete Trading Guide
By HorizonAI Team · 12 min read · Intermediate
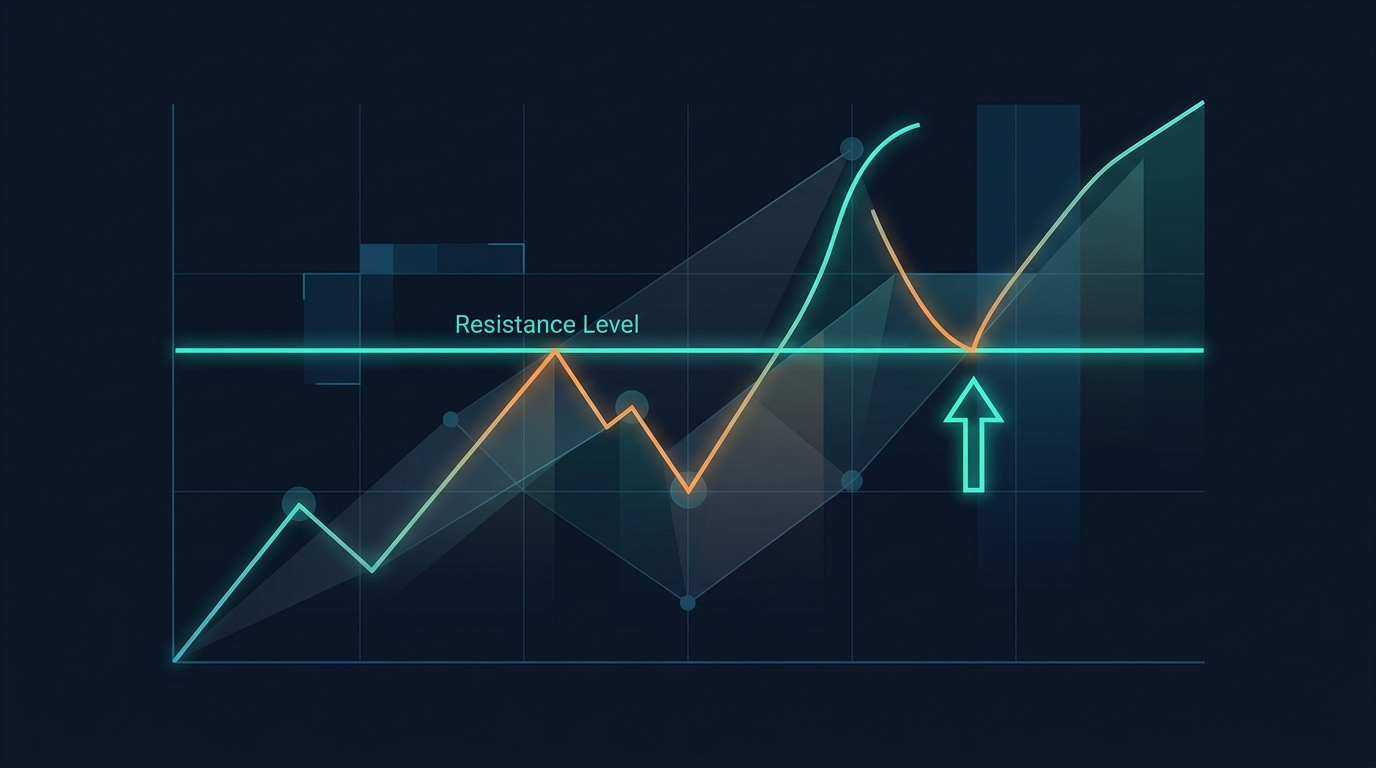
The Setup Most Traders Miss After a Breakout
You watch a key level break. Price rips through resistance, you chase the move, and then it reverses straight back down. You're stopped out. Then it rallies again, without you. This is one of the most common and expensive mistakes in technical analysis, and the break and retest strategy exists precisely to solve it.
Instead of chasing the initial break, you wait. Price breaks the level, pulls back to confirm the old resistance as new support (or vice versa), and then you enter with the wind at your back. The result is a tighter stop, a better risk-reward ratio, and a higher-probability entry than any breakout chaser will ever get.
What You'll Learn
- The exact mechanics of a valid break and retest, with specific confirmation rules
- How to filter false breakouts before they cost you money
- Entry, stop-loss, and take-profit parameters for swing trading timeframes
- A working Pine Script v6 strategy that detects and trades retests automatically
- How the opening range breakout strategy connects to this framework
- The best indicators for swing trading to stack on top of the setup
- Common mistakes that turn winning setups into losing trades
What a Break and Retest Actually Is
A break and retest is a two-phase price action sequence. In phase one, price closes convincingly beyond a significant level, such as a horizontal support/resistance zone, a trendline, or a prior swing high or low. In phase two, price returns to that level, which has now flipped its role, and reacts off it before continuing in the breakout direction.
The logic is institutional. Large players who missed the initial move use the pullback to accumulate positions at the newly established level. Retail traders who bought the breakout and are now sitting at breakeven either hold or add, creating a natural demand/supply cluster exactly at the retest zone.
This is not a pattern unique to one market. The break and retest works across forex, equities, crypto, and futures, on timeframes from the 15-minute chart to the weekly. The parameters shift, but the mechanics stay identical.
The Three Types of Levels Worth Retesting
Horizontal structure levels are the most reliable. These are price zones where the market has reversed at least twice previously. The more touches, the stronger the level, and the more meaningful the break.
Trendlines and channels produce retest setups that align with the broader trend direction, which adds confluence. A break above a descending trendline followed by a retest of that line as support is a classic swing trade entry.
Moving average confluences, specifically the 50 EMA and 200 EMA on the daily chart, act as dynamic levels that price frequently breaks and retests. These are especially useful in trending markets where horizontal levels are harder to define. For a deeper comparison of how different moving averages behave as dynamic support, see EMA vs SMA — Which Moving Average is Better for Trading?.
How to Identify a Valid Break (Not a Fake One)
The single biggest problem traders have with this strategy is distinguishing a real breakout from a fakeout. Here are the specific filters that separate them.
Candle Close Confirmation
Never act on a wick pierce. You need a full candle close beyond the level. On the daily chart, that means waiting for the daily candle to close above resistance before calling it a break. On the 4H chart, same rule applies.
For swing trading, the daily and 4H timeframes are your primary breakout confirmation charts. The 1H is used for entry refinement during the retest phase.
Volume Expansion
A legitimate break is accompanied by above-average volume. Specifically, breakout volume should be at least 1.5x the 20-period average volume on the breakout candle. If volume is flat or declining on the break, treat it as a potential fakeout and wait for more confirmation.
The 2-Bar Rule
For additional confirmation, require that price holds beyond the broken level for at least 2 consecutive candles before classifying it as a valid break. A single spike followed by an immediate reversal is a liquidity grab, not a breakout. This is closely related to the concept of liquidity sweeps, where smart money hunts stops above key levels before reversing.
The Retest Entry: Exact Rules
Once you have a confirmed break, you shift into entry mode. Here is the precise framework.
Retest Qualification Criteria
- Price must return to within 0.5% of the broken level (tighter on forex pairs, slightly wider on volatile crypto)
- The retest candle should show rejection, meaning a wick into the zone with the body closing back above (for bullish retests) or below (for bearish retests)
- RSI on the entry timeframe (1H) should be between 40-60 during the retest, confirming the pullback is a consolidation, not a trend reversal
- The retest should complete within 5-15 candles of the break on the entry timeframe. A retest that takes 30+ candles is often a sign the break is failing
Entry Trigger Options
Option A (Aggressive): Enter at the close of the first rejection candle at the retest zone. Stop below the zone low (for longs). This gets you a better price but slightly more risk.
Option B (Conservative): Wait for the candle after the rejection candle to break its high (for longs). This adds one bar of delay but confirms momentum is resuming. This is the preferred method for swing traders who prioritize accuracy over entry price.
Stop-Loss Placement
Place your stop 1 ATR(14) below the retest zone low for longs, or 1 ATR(14) above the retest zone high for shorts. This gives the trade room to breathe without invalidating the setup. Using ATR for stop placement is one of the most consistent methods in technical analysis for swing trading, and you can read more about calibrating it in the ATR Indicator Explained guide.
Take-Profit Targets
- TP1: 1.5x risk (close 50% of position)
- TP2: Next major structural level (close remaining 50%)
- Move stop to breakeven after TP1 is hit
Minimum acceptable risk-reward for taking the trade: 1:2. If the next major resistance is too close to justify this, skip the setup.
The Opening Range Breakout Connection
The opening range breakout strategy is a time-specific application of the same break and retest logic. The opening range is defined as the high and low of the first 30 minutes (or first hour) of the trading session. When price breaks above or below this range, traders watch for a retest of the range boundary before entering.
For stocks and futures, the most reliable opening range breakout setups occur between 9:30-10:30 AM EST. The range is established in the first 30 minutes, and the retest entry is taken between 10:00-11:30 AM if price pulls back to the broken range boundary.
Key filters for ORB retests:
- Premarket volume should be at least 2x average (signals institutional participation)
- The initial breakout candle should be at least 0.3% in size (filters noise)
- Avoid ORB setups on FOMC days, CPI releases, or earnings days unless you specifically trade news volatility
The ORB strategy works best on liquid instruments: SPY, QQQ, ES futures, EUR/USD, and large-cap stocks with daily volume above 5 million shares.
Best Indicators for Swing Trading to Stack on This Setup
The break and retest pattern is a price action foundation. The best swing trade indicators add confluence, not noise. Here are the four worth using.
1. RSI (14-period)
Use RSI to confirm the retest is a healthy pullback. On bullish retests, RSI should pull back to the 40-50 zone without going below 30. An RSI below 30 during a retest suggests the move may be reversing, not consolidating.
2. MACD (12/26/9)
Look for MACD histogram to be contracting (bars getting smaller) during the retest and then expanding in the breakout direction as price bounces. A MACD crossover on the 4H chart during the retest zone is a strong entry trigger. For a full breakdown of how RSI and MACD interact, the RSI vs MACD comparison covers exactly when to use each.
3. Volume Profile / Average Volume
Volume should decline during the retest (normal consolidation behavior) and expand on the resumption candle. If volume spikes during the retest itself, the level may be failing.
4. ATR (14-period)
Used for stop placement and position sizing. Current ATR tells you how volatile the instrument is right now, which determines how wide your stop needs to be to avoid being shaken out by normal price movement.
| Indicator | Role in Setup | Key Signal |
|---|---|---|
| RSI 14 | Pullback quality | 40-55 zone during retest |
| MACD 12/26/9 | Momentum confirmation | Histogram expanding on bounce |
| Volume | Breakout validity | 1.5x average on break candle |
| ATR 14 | Stop placement | 1 ATR below retest zone low |
Pine Script v6 Strategy: Break and Retest
This strategy identifies horizontal swing highs/lows, detects breaks, and enters on the retest. It's designed for the 4H timeframe on forex or crypto pairs.
//@version=6
strategy("Break and Retest Strategy", overlay=true, default_qty_type=strategy.percent_of_equity, default_qty_value=2)

// ─── INPUTS ───────────────────────────────────────────────────────────────────
swingLen      = input.int(10, "Swing Lookback Length", minval=5)
atrLen        = input.int(14, "ATR Length")
atrMult       = input.float(1.0, "ATR Stop Multiplier", step=0.1)
retestTol     = input.float(0.005, "Retest Tolerance (0.5%)", step=0.001)
volMult       = input.float(1.5, "Min Volume Multiplier for Break", step=0.1)
rsiLen        = input.int(14, "RSI Length")
rsiLow        = input.int(40, "RSI Min During Retest")
rsiHigh       = input.int(60, "RSI Max During Retest")

// ─── CALCULATIONS ─────────────────────────────────────────────────────────────
atrVal        = ta.atr(atrLen)
avgVol        = ta.sma(volume, 20)
rsiVal        = ta.rsi(close, rsiLen)

// Detect swing highs and lows
swingHigh     = ta.pivothigh(high, swingLen, swingLen)
swingLow      = ta.pivotlow(low, swingLen, swingLen)

// Store the most recent confirmed swing levels
var float lastSwingHigh = na
var float lastSwingLow  = na

if not na(swingHigh)
    lastSwingHigh := swingHigh
if not na(swingLow)
    lastSwingLow := swingLow

// ─── BREAK CONDITIONS ─────────────────────────────────────────────────────────
// Bullish break: close above last swing high with volume confirmation
bullBreak = not na(lastSwingHigh) and
             close > lastSwingHigh and
             close[1] <= lastSwingHigh and
             volume > avgVol * volMult

// Bearish break: close below last swing low with volume confirmation
bearBreak = not na(lastSwingLow) and
             close < lastSwingLow and
             close[1] >= lastSwingLow and
             volume > avgVol * volMult

// Track broken level and direction
var float brokenLevel = na
var int   breakDir    = 0   // 1 = bullish break, -1 = bearish break
var int   barsSinceBreak = 0

if bullBreak
    brokenLevel   := lastSwingHigh
    breakDir      := 1
    barsSinceBreak := 0
elif bearBreak
    brokenLevel   := lastSwingLow
    breakDir      := -1
    barsSinceBreak := 0

if not na(brokenLevel)
    barsSinceBreak += 1

// Reset if retest window expires (15 bars)
if barsSinceBreak > 15
    brokenLevel   := na
    breakDir      := 0
    barsSinceBreak := 0

// ─── RETEST CONDITIONS ────────────────────────────────────────────────────────
// Bullish retest: price returns to broken resistance (now support)
// RSI in 40-60 zone confirms healthy pullback
bullRetest = breakDir == 1 and
              not na(brokenLevel) and
              low <= brokenLevel * (1 + retestTol) and
              low >= brokenLevel * (1 - retestTol) and
              close > brokenLevel and
              rsiVal >= rsiLow and rsiVal <= rsiHigh

// Bearish retest: price returns to broken support (now resistance)
bearRetest = breakDir == -1 and
              not na(brokenLevel) and
              high >= brokenLevel * (1 - retestTol) and
              high <= brokenLevel * (1 + retestTol) and
              close < brokenLevel and
              rsiVal >= rsiLow and rsiVal <= rsiHigh

// ─── ENTRIES AND EXITS ────────────────────────────────────────────────────────
if bullRetest and strategy.position_size == 0
    stopPrice  = brokenLevel - atrVal * atrMult
    riskPoints = close - stopPrice
    tp1        = close + riskPoints * 1.5
    tp2        = close + riskPoints * 3.0
    strategy.entry("Long Retest", strategy.long)
    strategy.exit("Long TP1", "Long Retest", limit=tp1, stop=stopPrice, qty_percent=50)
    strategy.exit("Long TP2", "Long Retest", limit=tp2, stop=stopPrice, qty_percent=50)

if bearRetest and strategy.position_size == 0
    stopPrice  = brokenLevel + atrVal * atrMult
    riskPoints = stopPrice - close
    tp1        = close - riskPoints * 1.5
    tp2        = close - riskPoints * 3.0
    strategy.entry("Short Retest", strategy.short)
    strategy.exit("Short TP1", "Short Retest", limit=tp1, stop=stopPrice, qty_percent=50)
    strategy.exit("Short TP2", "Short Retest", limit=tp2, stop=stopPrice, qty_percent=50)

// ─── VISUALS ──────────────────────────────────────────────────────────────────
// Plot the broken level when active
plot(not na(brokenLevel) ? brokenLevel : na, "Broken Level",
     color=breakDir == 1 ? color.new(color.teal, 0) : color.new(color.orange, 0),
     style=plot.style_line, linewidth=2)

// Mark break candles
plotshape(bullBreak, "Bull Break", shape.triangleup, location.belowbar, color.teal, size=size.small)
plotshape(bearBreak, "Bear Break", shape.triangledown, location.abovebar, color.orange, size=size.small)

// Mark retest entries
plotshape(bullRetest, "Bull Retest Entry", shape.circle, location.belowbar, color.green, size=size.tiny)
plotshape(bearRetest, "Bear Retest Entry", shape.circle, location.abovebar, color.red, size=size.tiny)

// Background highlight when a broken level is being tracked
bgcolor(not na(brokenLevel) ? color.new(color.blue, 92) : na, title="Active Break Zone")
Recommended settings: Run this on 4H EUR/USD or BTC/USD. Backtest a minimum of 200 trades before drawing conclusions. Adjust
retestTolto 0.008 for more volatile assets like crypto.
Common Mistakes That Kill This Strategy
❌ Mistake 1: Treating Every Level as Equal
Not all horizontal levels are created equal. A level that has been tested once is weak. A level tested 3-5 times over multiple weeks or months is where institutional memory lives. Only trade retests of high-confluence levels with multiple prior touches.
✅ Do This: Before trading a retest, count the touches. Require at least 2 prior reactions at the exact level. Use the weekly chart to identify the level, then drop to 4H for entry.
❌ Mistake 2: Entering on the First Candle That Touches the Level
Price touching a level is not a retest. A retest requires a rejection signal, meaning the candle wicks into the zone and closes away from it, or a sequence of candles consolidates at the level and then breaks in the breakout direction.
✅ Do This: Wait for a pin bar, engulfing candle, or inside bar at the retest zone before entering. The entry trigger is the close of that rejection candle, not the touch.
❌ Mistake 3: Ignoring the Broader Market Structure
A bullish retest on the 4H chart means nothing if the daily chart is in a clear downtrend. You are trading against the dominant flow and your win rate will suffer.
✅ Do This: Always check one timeframe higher before entering. The higher timeframe trend should align with your retest direction. For swing trading, use the weekly to define trend, daily for level identification, 4H for entry.
❌ Mistake 4: Moving the Stop Loss Wider After Entry
When price comes back and tests your stop zone, the temptation is to widen the stop. Resist this. The stop is placed where the setup is invalidated. If price reaches that zone, the setup is dead.
✅ Do This: Define your stop before entry. If the resulting risk is too large relative to your account, reduce position size, do not widen the stop. See the risk management guide for position sizing formulas.
❌ Mistake 5: Skipping the Volume Check on the Break
A break without volume is a trap. Price can pierce a level on low volume, trigger stops, and reverse. This is a liquidity sweep masquerading as a breakout.
✅ Do This: Require the break candle volume to be at least 1.5x the 20-period average. No volume expansion, no trade.
Pro Tips for Experienced Traders
Tip 1: Stack the retest with a Fair Value Gap. When the retest zone overlaps with an unfilled FVG from the breakout move, the probability of a successful bounce increases significantly. Institutions often return to fill imbalances before continuing. Read more about this in Fair Value Gaps and Imbalances.
Tip 2: Use the 50% retracement as a precision entry. Within the retest zone, the 50% retracement of the breakout candle is often the exact point where price bounces. This gives you a tighter stop and a better R:R than entering at the zone boundary.
Tip 3: Scale entries across a zone, not at a single price. If your retest zone is 10 pips wide (on forex) or 0.5% wide (on crypto), put 50% of your position at the first touch of the zone and the remaining 50% at the zone midpoint. This averages your entry without doubling risk.
Tip 4: Time the retest with session opens. Retests that occur at the London open (3:00 AM EST) or New York open (8:30 AM EST) have higher follow-through because institutional order flow enters the market at these times. A retest that sits quietly overnight and then gets rejected at the London open is a high-quality setup.
Build This Strategy Without Writing Code
If you want to customize the Pine Script above, or build an MQL5 version for MetaTrader, HorizonAI generates complete, working code from plain-English descriptions. For example:
- "Build a Pine Script strategy that detects breaks of 20-bar swing highs with 1.5x volume confirmation, then enters on retests with RSI between 40 and 60, stop 1 ATR below the zone, TP at 2R and 3R."
- "Create an MQL5 EA that trades opening range breakout retests on the 30-minute chart for EUR/USD, with a hard stop at 1.2x ATR and a trailing stop after 1.5R."
- "Add a MACD histogram filter to my break and retest strategy so it only enters when the histogram is positive and expanding on the 4H chart."
The output is production-ready code with comments, which you can paste directly into TradingView or MetaTrader and start backtesting within minutes.
FAQs
Does the break and retest strategy work on all timeframes?
It works on any timeframe where significant structural levels exist, but the quality of setups improves on higher timeframes. The daily and 4H charts produce the most reliable retests because more market participants are watching those levels. Below the 15-minute chart, noise becomes a significant problem.
How do I know if a retest has failed?
A retest fails when price closes back through the broken level in the opposite direction of the trade. For a bullish retest, if price closes below the former resistance level (now support), the setup is invalidated. Exit immediately, do not wait for your stop to be hit if the close confirmation is clear.
What is the win rate of the break and retest strategy?
Backtested win rates typically range from 45-60% depending on the filters applied. The strategy is not about win rate alone. With a minimum 1:2 risk-reward and a 50% win rate, the strategy is profitable. Tightening entry criteria (volume filter, RSI filter, multi-touch levels) pushes win rate toward the higher end of that range.
Can I combine this with Smart Money Concepts?
Absolutely. Break and retest is essentially the retail-language version of what SMC traders call a "break of structure followed by a return to the point of interest." Order blocks, fair value gaps, and liquidity sweeps all provide additional confluence for retest entries. The Smart Money Concepts trading guide covers how to identify these institutional footprints.
How many trades per month should I expect?
On the 4H chart across 3-5 forex pairs, expect 8-15 valid setups per month with all filters applied. On the daily chart, expect 4-8. Do not lower your standards to generate more trades. Quality over frequency is the correct approach with this strategy.
Final Thoughts
The break and retest strategy is one of the cleanest entries in technical analysis for swing trading because it solves the chasing problem at the root. You stop trying to predict breakouts and start reacting to confirmed ones with a defined edge. The combination of structural level quality, volume-confirmed breaks, and rejection-based retest entries produces a framework that is both systematic and adaptable.
The one pro tip to take away: mark your levels on the weekly chart first, every single week. The levels that have held for months are the ones that produce the most violent and reliable reactions on the retest. Everything else, the RSI filter, the volume check, the ATR stop, is just noise reduction around those foundational zones.
Related Articles
- Market Structure Mastery — Higher Highs, Lower Lows, and Break of Structure Explained — The foundation for identifying levels worth retesting
- ATR Indicator Explained — How to Use Average True Range in Trading — Calibrate your stops and position sizes correctly
- RSI vs MACD — Which Indicator Is Better for Trading? — Choose the right confirmation indicator for your style
- Fair Value Gaps (FVG) and Imbalances — How to Build High-Probability SMC Entry Models — Stack FVGs with retest zones for higher-probability entries
- Liquidity Sweeps Explained — How Smart Money Hunts Stop Losses — Understand why fake breakouts happen before real ones
- Swing Trading Mean Reversion — High-Probability Setups Across Stocks, Forex, and Crypto — Complement breakout entries with mean reversion filters
- Risk Management in Trading — Position Sizing, Stop Losses, and Risk-Reward Ratios — Size positions correctly for every retest trade
- 7 Best Pine Script Strategies for TradingView (With Code) — More ready-to-use strategy code for TradingView
- Trend-Following Strategy Guide — Building One That Actually Works — Align break and retest entries with the dominant trend
- Backtesting Mistakes to Avoid — 7 Deadly Mistakes — Validate your retest strategy without fooling yourself
Questions about the break and retest strategy? Join our Discord to discuss with other traders!