
Order Flow
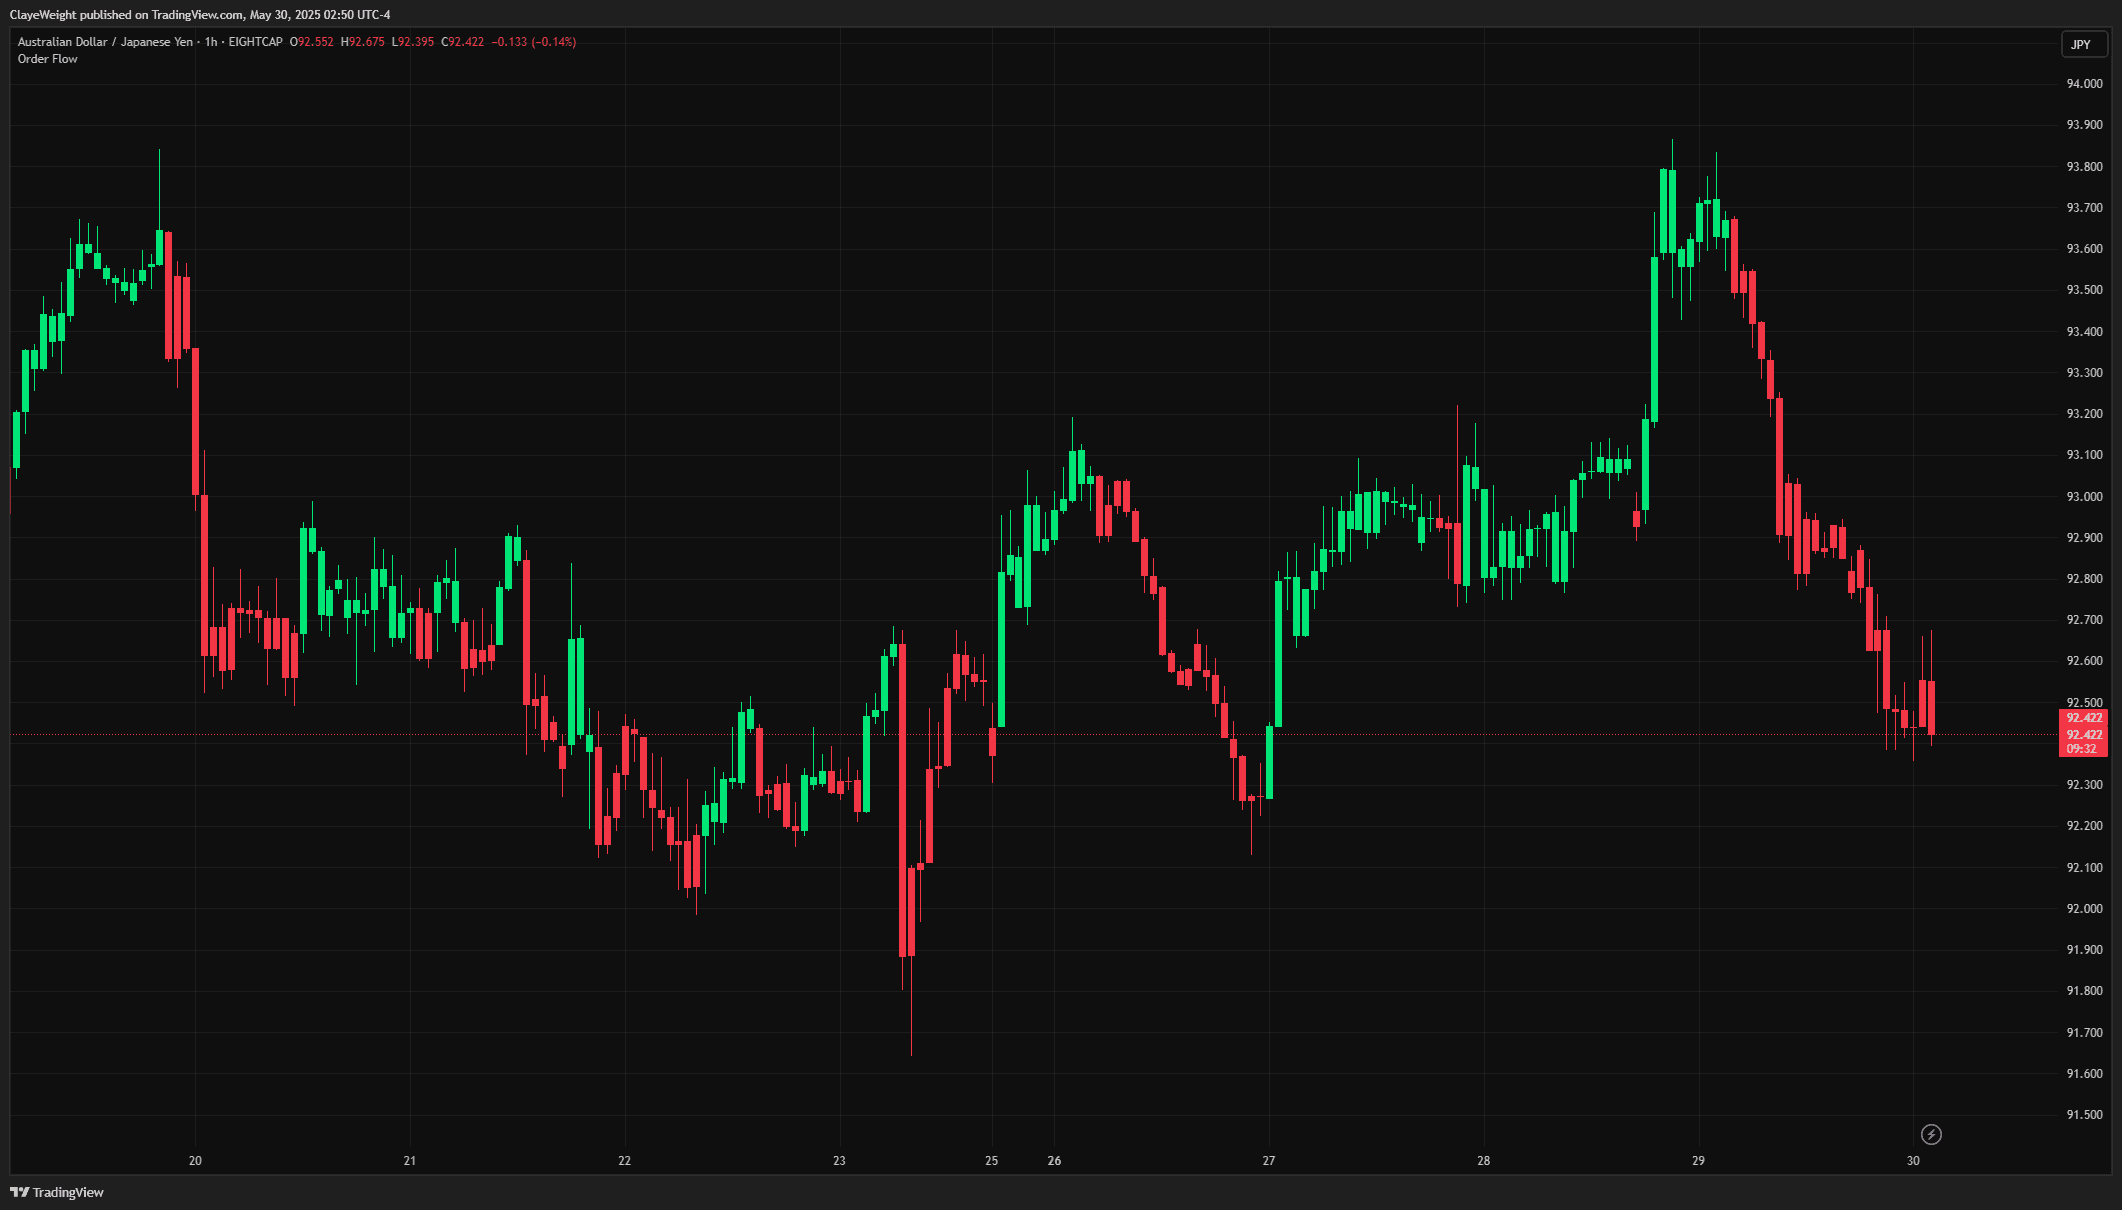
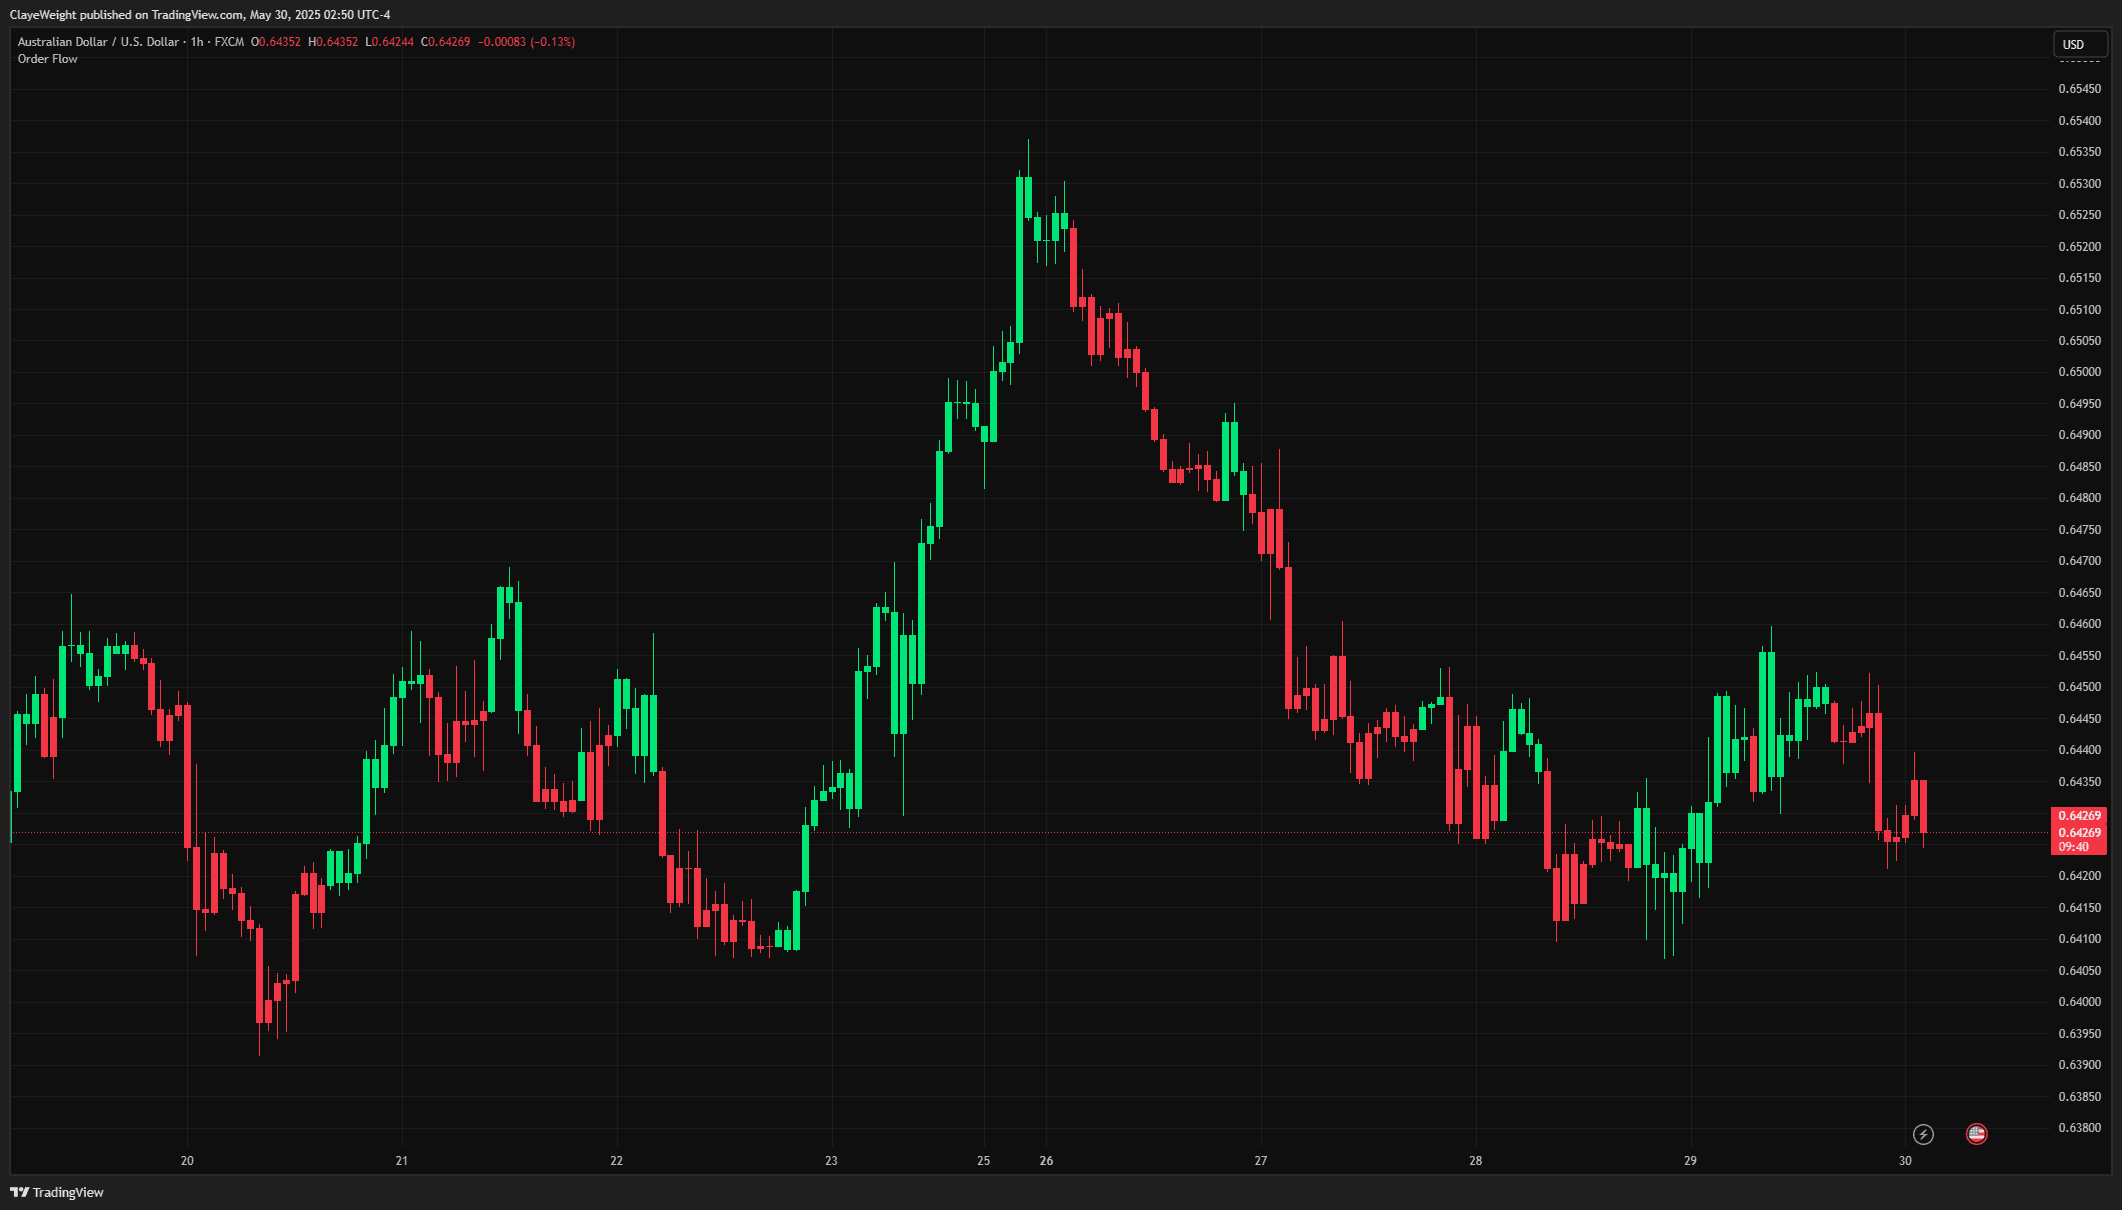
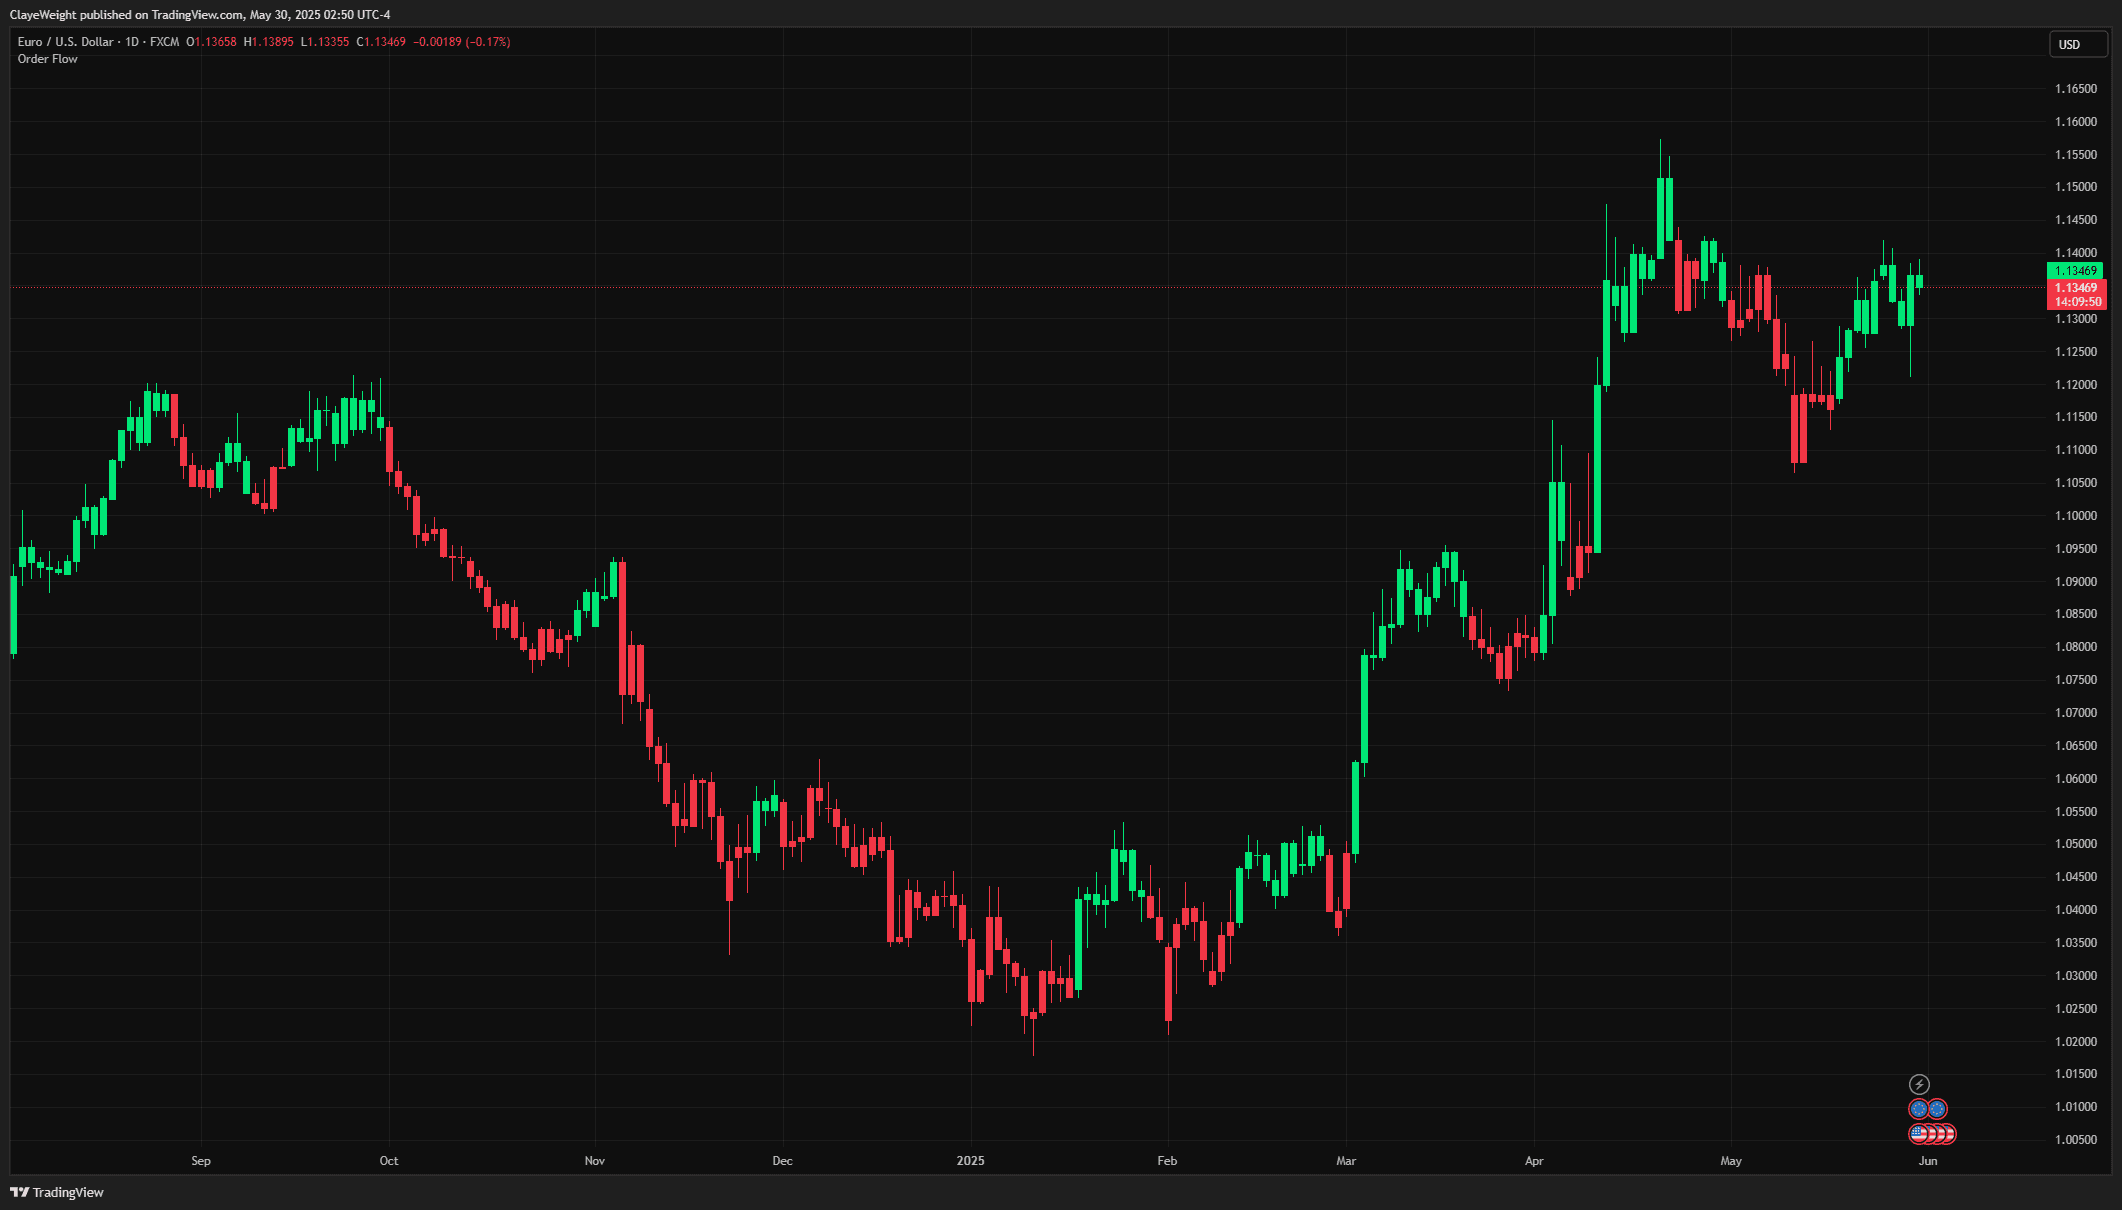
See the battle between buyers and sellers in real-time. This indicator breaks down each candle into buying and selling volume, showing you the actual order flow behind price movements.
What's Included
How Order Flow works
Order flow is the study of the buying and selling pressure behind each move rather than just the resulting price. The core idea is to break a candle down into estimated buy-side and sell-side volume, compute the difference between them (delta), and track how that difference accumulates over time (cumulative delta) to reveal who is in control beneath the surface.
From that breakdown come two key readings. Imbalance is when one side clearly overwhelms the other, hinting at aggression that may drive continuation. Absorption is the opposite tell, where heavy volume meets little price movement, suggesting a large passive participant is soaking up the aggression and the move may be stalling.
An important honesty note: on standard chart data the split between buying and selling is estimated from price and volume behaviour, not read directly from the exchange's matching engine. It is an approximation of true order flow, useful for gauging pressure and spotting imbalance or absorption, but it is not the same as tick-by-tick exchange footprint data and should be read with that limitation in mind.
When to use it
- Gauging whether a move is backed by genuine one-sided pressure or is running on thin participation.
- Spotting absorption where strong volume fails to move price, hinting a move may be exhausting.
- Using cumulative delta to see whether buyers or sellers have been in control across a session.
- Adding a pressure lens to confirm or question a setup you found with structure or price action.
When it's not the right tool
- Treating the estimated buy/sell split as exact exchange order-flow data, which it is not on standard charts.
- On low-volume or illiquid instruments where the volume estimate is noisy and easily distorted.
- As a standalone signal without price context, since delta can diverge from price for extended periods.
Source Code Preview
Get the full PineScript v6 source code—use it as a foundation and build on top of it with HorizonAI.
Frequently asked questions
Is this real exchange order-flow data?
Not on standard chart feeds. The buying and selling split is estimated from price and volume rather than read from the exchange's order-matching engine, so it approximates order flow. True footprint data requires specialised tick-level feeds, and this should be treated as a proxy.
What do delta and cumulative delta actually show?
Delta is the estimated difference between buying and selling volume on a candle, showing which side was more aggressive. Cumulative delta adds those values over time to reveal the running balance of pressure across a session or trend.
What is the difference between imbalance and absorption?
Imbalance is one side strongly outweighing the other, suggesting aggression that can push price. Absorption is heavy volume meeting little price movement, suggesting a passive participant is absorbing that aggression and the move may be losing steam.
Can I rely on order flow alone for entries?
It is best used as confirmation rather than a sole trigger, because estimated delta can diverge from price and produce misleading reads on thin volume. Combine it with structure, levels and your own risk plan, and remember nothing here is financial advice.
Related Scripts
 Pro
ProMarket Structure
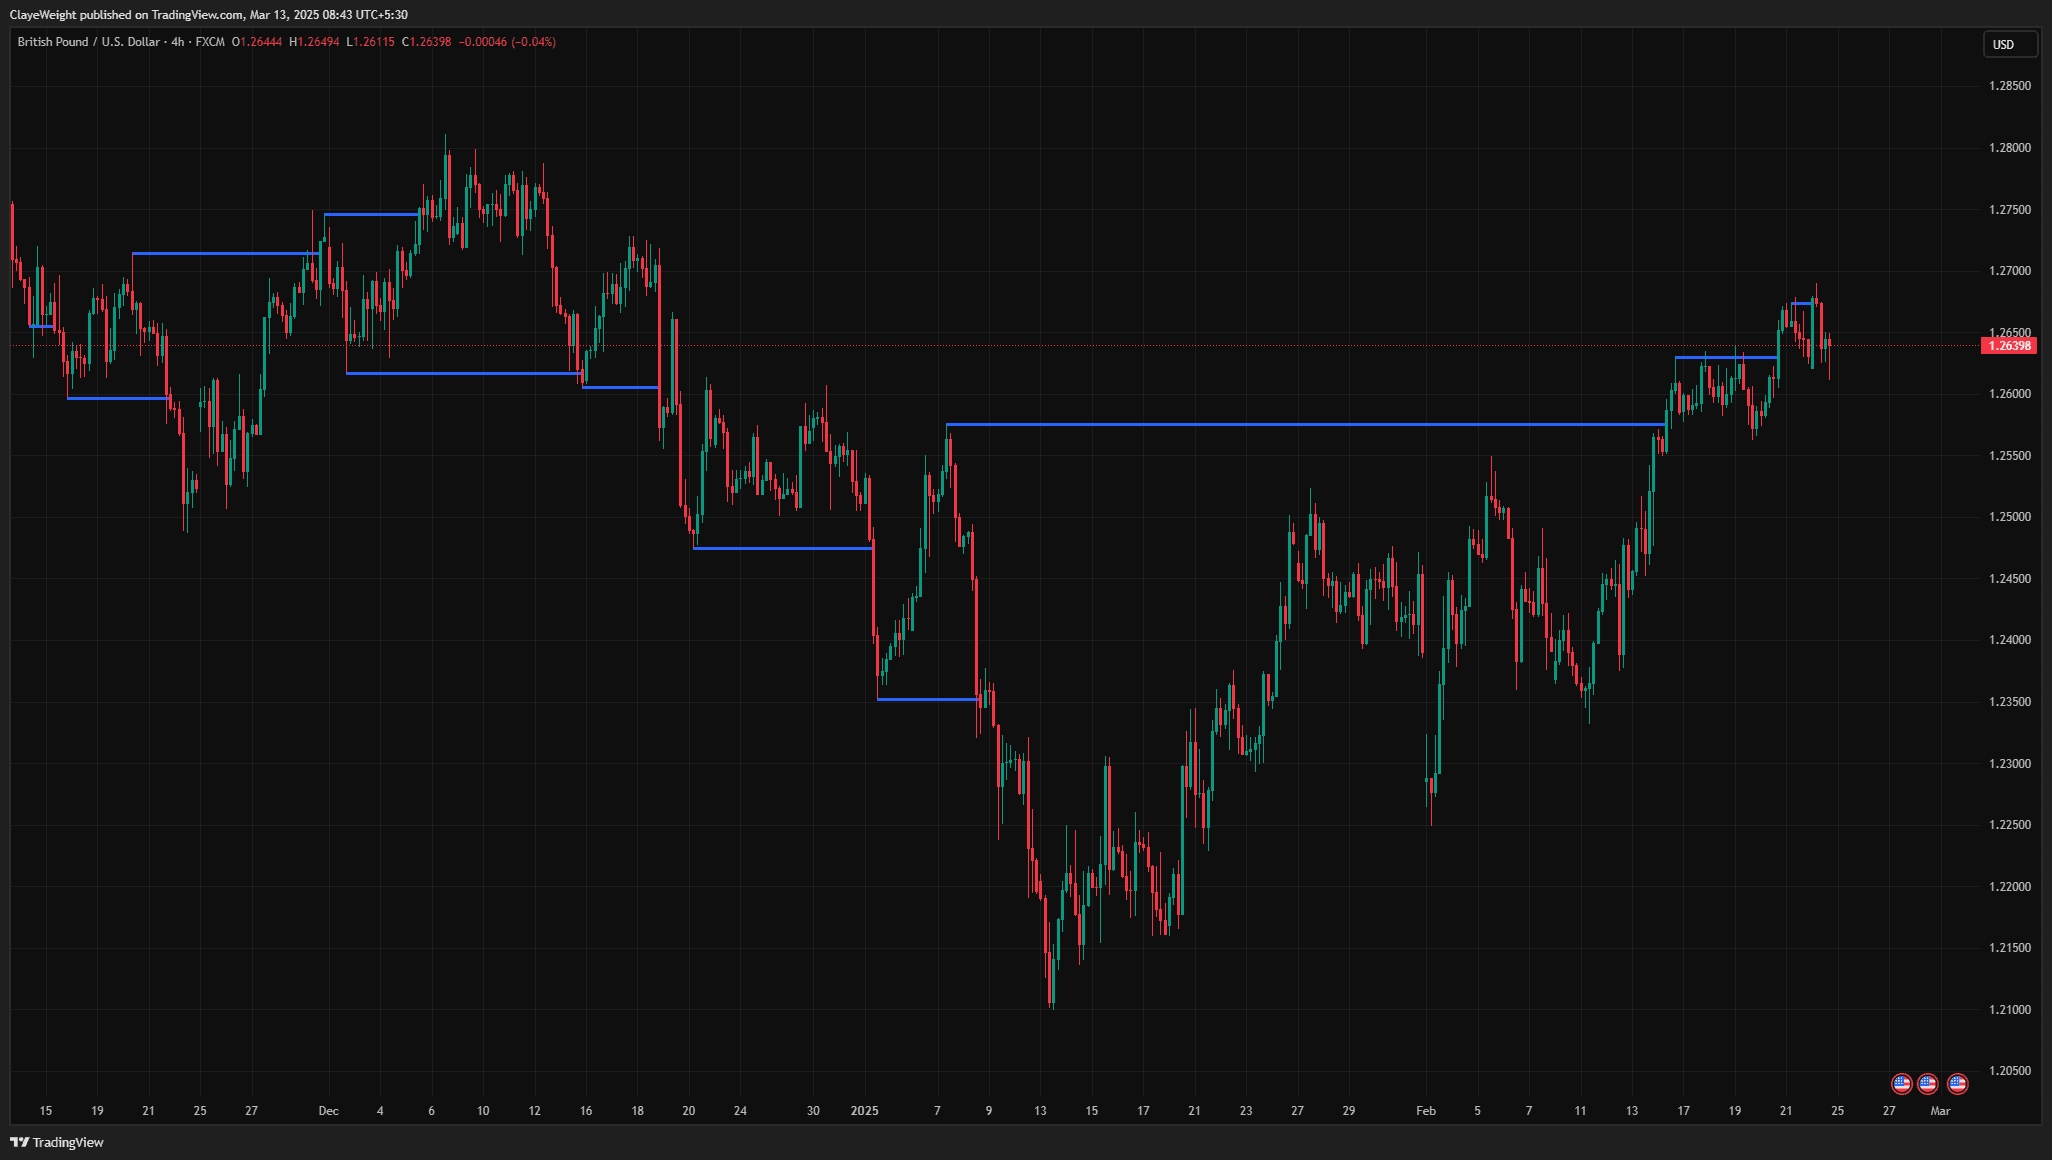
Automatically maps swing highs and lows with break of structure detection.
 Pro
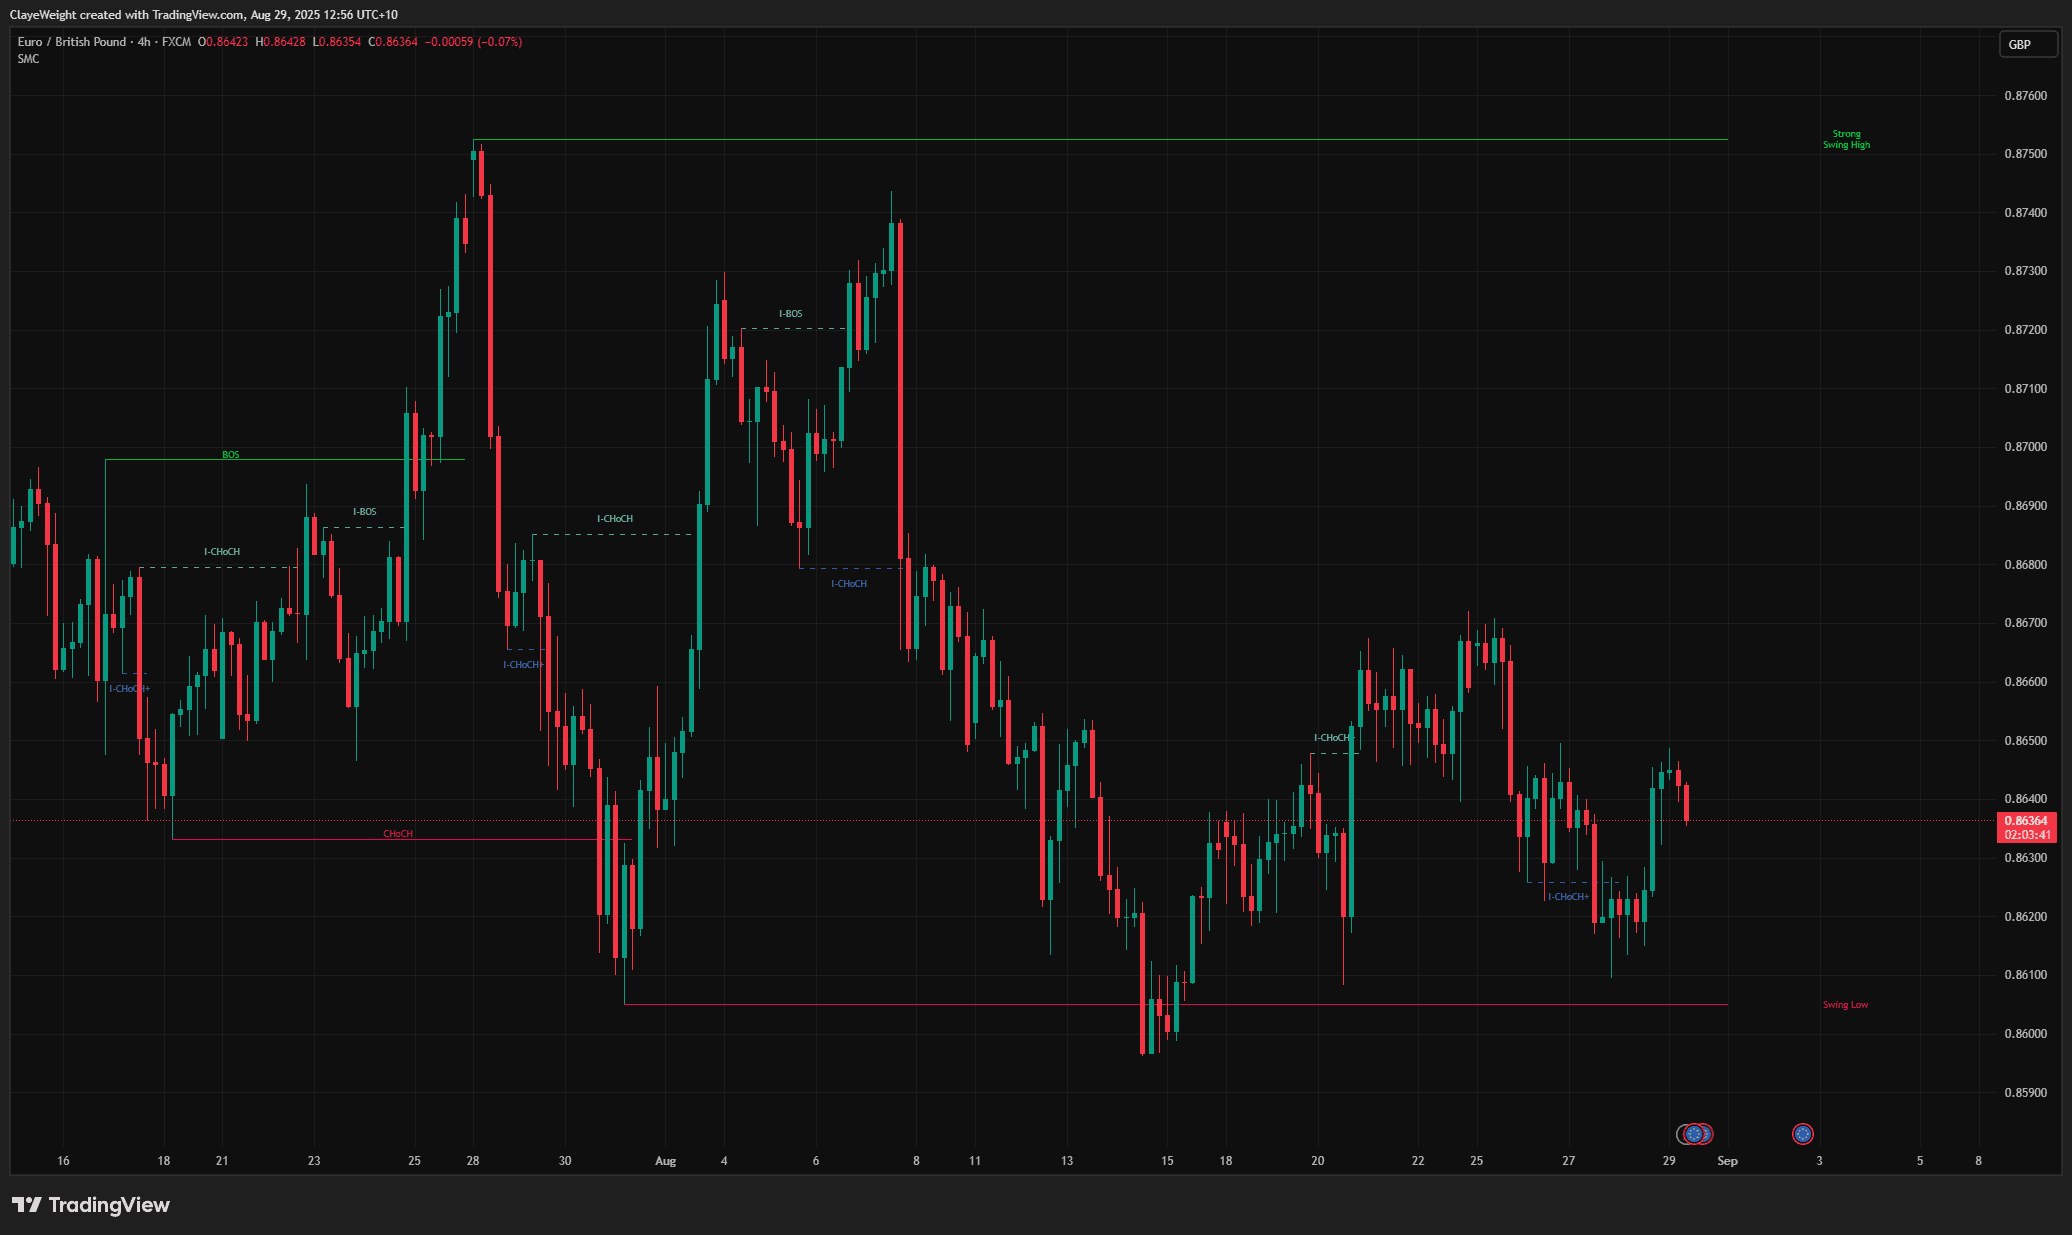
ProSMC Market Structure Pro
Advanced Smart Money Concepts with internal and swing structure mapping.
 Free
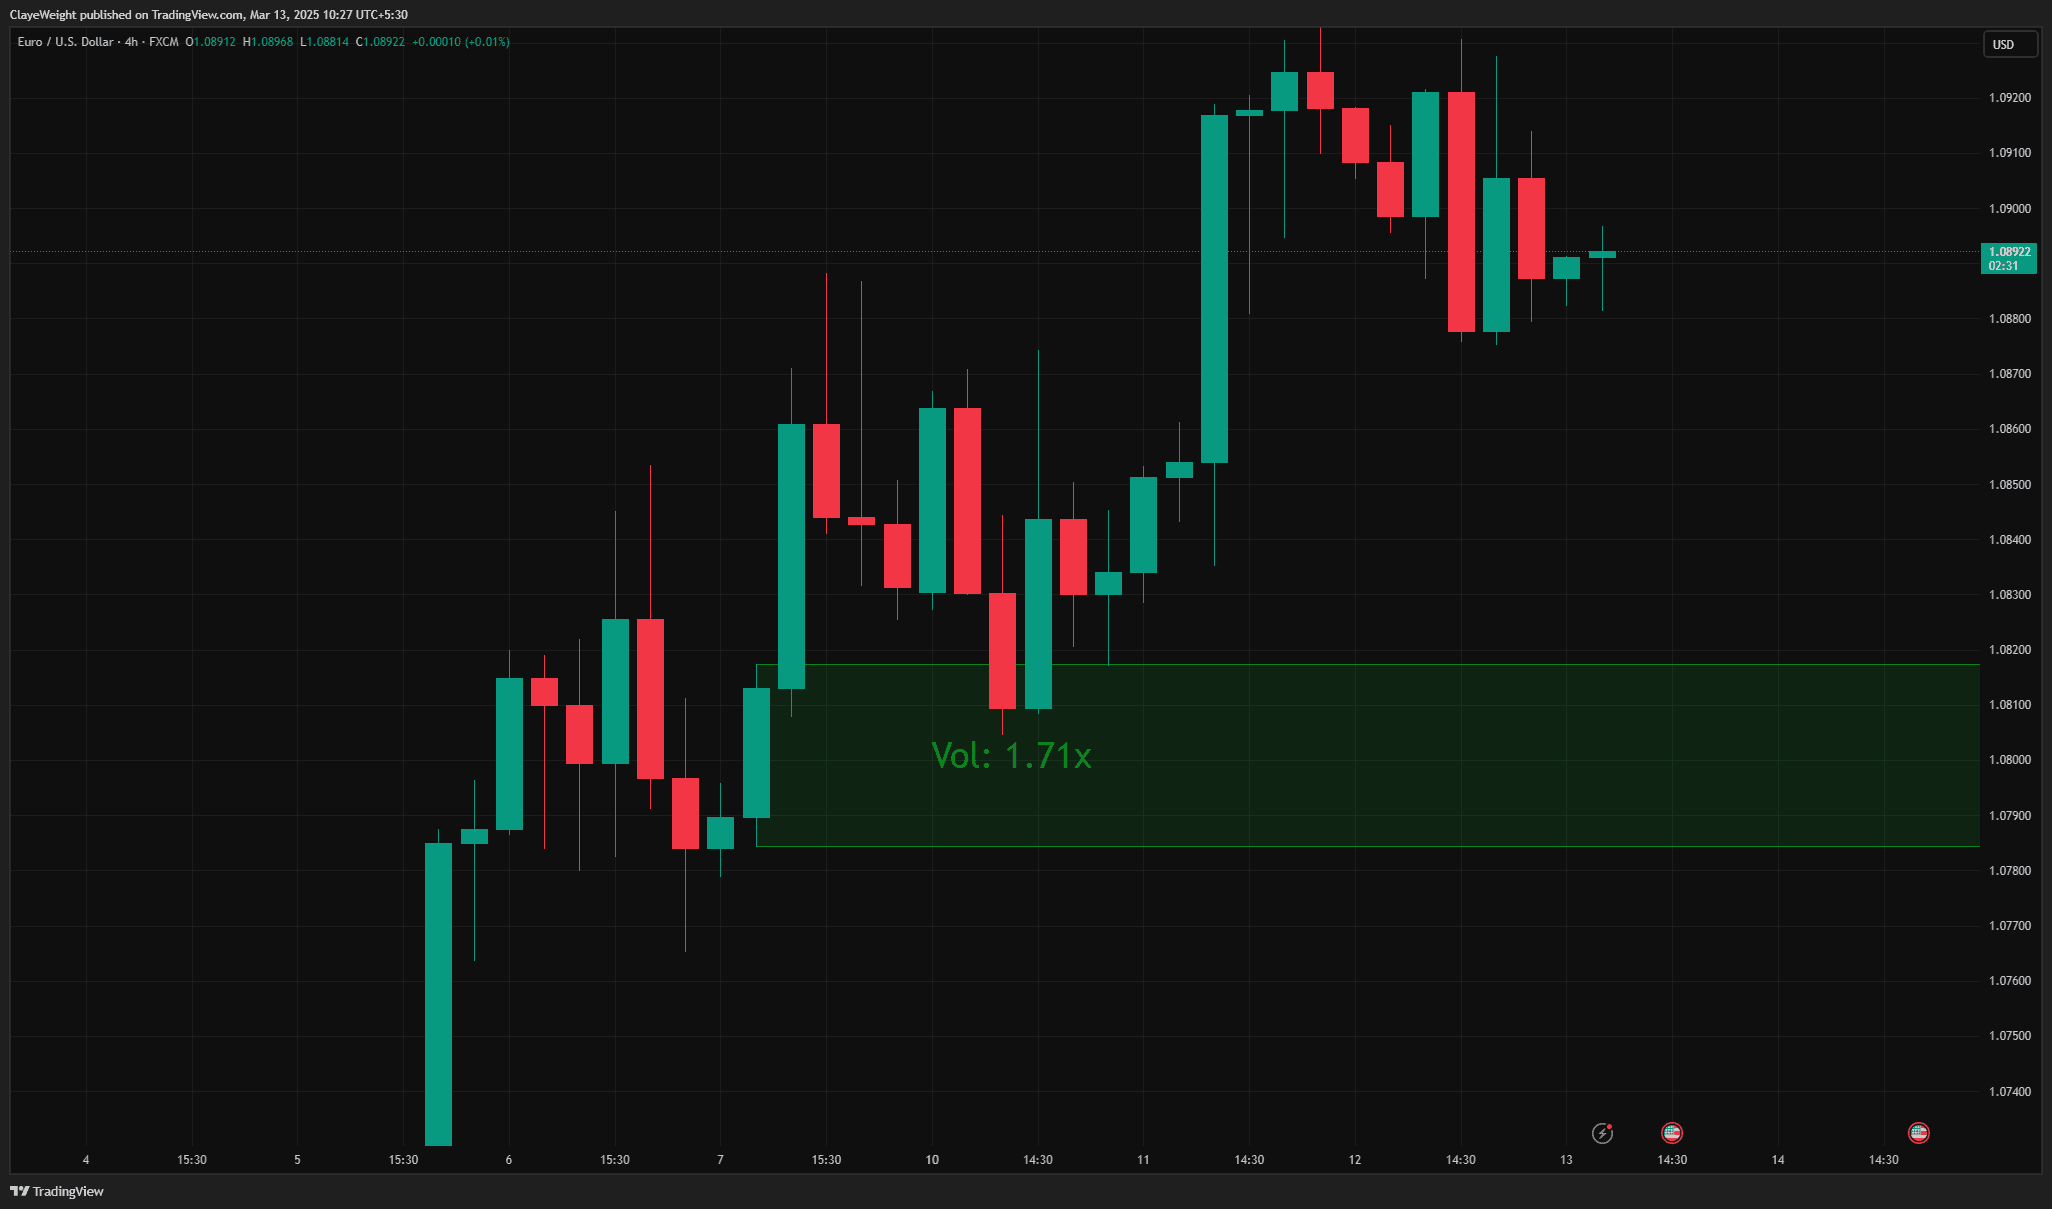
FreeAdvanced Order Blocks with Volume
A professional-grade indicator that combines order block detection with sophisticated volume analysis.
Get access to all 23+ scripts
Full source code, alert templates, and the perfect base to build on with HorizonAI. Join 10,000+ traders.