
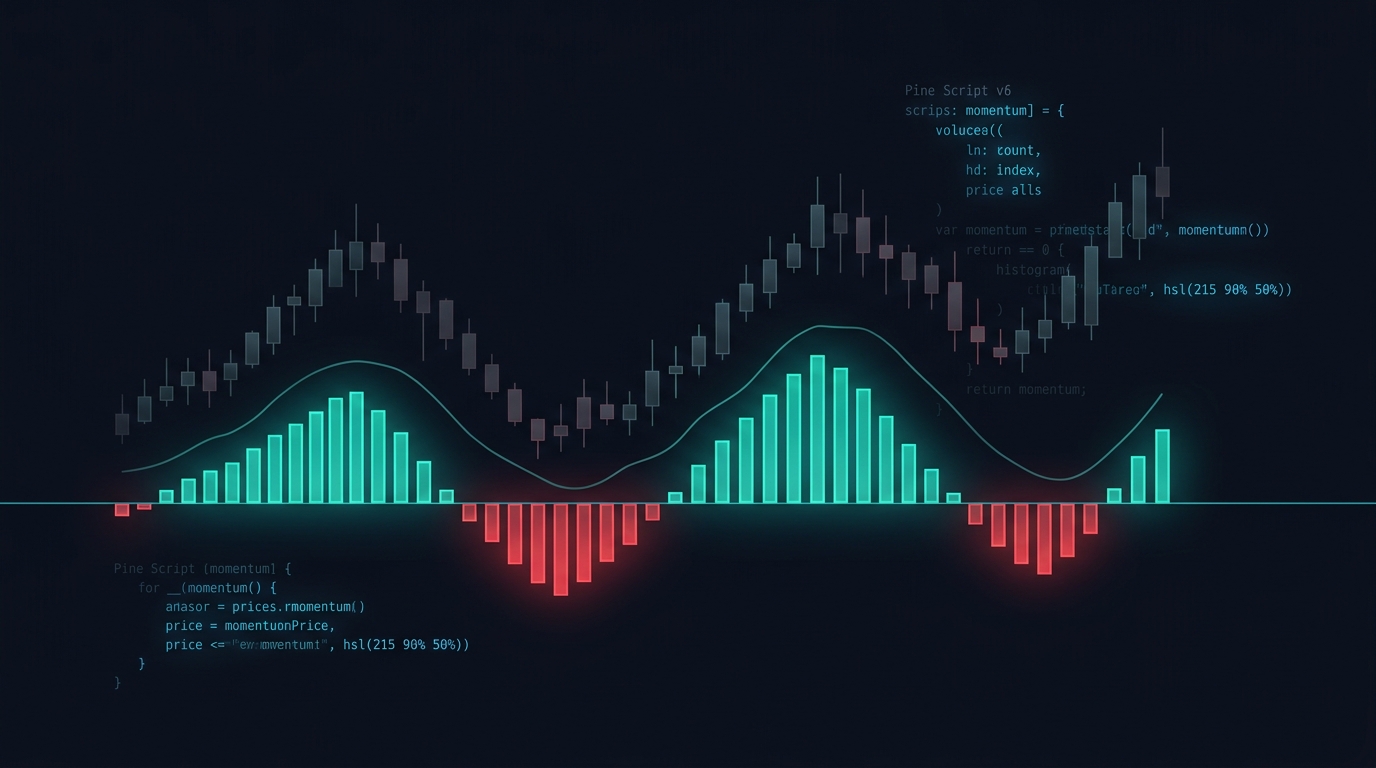
How to Build a Momentum Indicator in Pine Script v6
By HorizonAI Team · 12 min read · Intermediate
How to Code a Momentum Indicator in Pine Script v6
Price is rising, but is it rising faster than it was ten bars ago? That is the question a momentum indicator answers without burying it under extra signals. You can build one in Pine Script with a single price difference, then add percentage scaling, smoothing, a zero line, alerts, and an optional confirmed higher-timeframe regime filter.
Short answer: Raw momentum is close - close[length]; it measures the point or dollar change over a lookback. Percentage rate of change, or ROC, is 100 * (close / close[length] - 1); it normalizes that same change so readings are comparable across symbols and price levels. The Pine Script v6 indicator below lets you switch between both, smooth the result with an EMA, plot it as a histogram or line, and create zero-line alerts.
Use raw momentum when you care about the absolute move in the instrument's native price units. Use ROC when you compare different markets, such as a $30 stock and a $3,000 stock, or when a symbol's price level has changed materially over time. Neither reading predicts direction by itself. They show whether the market has gained or lost ground relative to a defined starting bar, which makes them useful as a confirmation layer beside structure, a moving average, or a breakout rule.
What you are building
The finished script is a separate-pane oscillator with five controls:
- Lookback length, default 14 bars.
- Calculation mode, raw momentum or percentage ROC.
- EMA smoothing, default 5 bars.
- Display mode, histogram or line.
- Optional higher-timeframe regime, calculated from the last completed higher-timeframe bar.
It draws a zero line because zero is the clean decision boundary. A positive reading means the current close is above the close length bars ago. A negative reading means it is below it. The indicator also exposes alerts when the smoothed chart-timeframe reading crosses that boundary.
This is deliberately smaller than an oscillator with several internal averages. If you want a momentum histogram built around volatility compression rather than price change, see the Squeeze Momentum indicator build. If you need a paired momentum and mean-reversion view, the combined RSI and MACD indicator solves a different problem.
The two calculations, from first principles
Raw momentum compares today's close with a prior close:
momentum = close - close[length]
With a 14-bar length, a reading of 5.00 means price is five points above its close 14 bars ago. On EURUSD, the same number would be enormous. On an index future, it might be routine. That is why raw momentum is best interpreted within one instrument and one price regime.
Rate of change converts the comparison into a percentage:
ROC = 100 × (close / close[length] - 1)
If the current close is 105 and the close 14 bars ago was 100, ROC is 5%. If the current close is 95, ROC is -5%. The zero line still has the same meaning, but the scale travels better across markets.
A 14-bar default is a practical starting point, not a sacred setting. On a 5-minute chart, it describes roughly the last 70 minutes of session movement. On a daily chart, it describes nearly three trading weeks. Shorter values such as 5 or 8 react earlier and whip more. Values near 20 or 30 filter noise but respond later.
Paste this Pine Script v6 indicator into TradingView
Open TradingView's Pine Editor, create a new indicator, replace the editor contents with this code, and click Add to chart. Pine uses indicator() for a study rather than strategy(), so this script plots information but does not place simulated orders. TradingView documents the indicator declaration and built-in technical-analysis functions in its Pine Script documentation.
//@version=6
indicator("Transparent Momentum and ROC", shorttitle = "Mom/ROC", overlay = false)

// Core controls
length = input.int(14, "Lookback length", minval = 1)
mode = input.string("Percent ROC", "Calculation", options = ["Raw Momentum", "Percent ROC"])
smoothingLength = input.int(5, "EMA smoothing", minval = 1)
displayMode = input.string("Histogram", "Display", options = ["Histogram", "Line"])

// Optional higher-timeframe regime confirmation
useHigherTimeframe = input.bool(false, "Use confirmed higher-timeframe regime")
higherTimeframe = input.timeframe("60", "Higher timeframe")
showRegimeBackground = input.bool(true, "Color background by regime")

// Chart-timeframe calculations
rawMomentum = close - close[length]
percentRoc = 100 * (close / close[length] - 1)
selectedValue = mode == "Raw Momentum" ? rawMomentum : percentRoc
smoothedValue = ta.ema(selectedValue, smoothingLength)

// Previous completed higher-timeframe bar. The [1] offset plus lookahead_on
// avoids using an unfinished higher-timeframe value on lower-timeframe bars.
higherRawMomentum = request.security(
     syminfo.tickerid,
     higherTimeframe,
     close[1] - close[length + 1],
     lookahead = barmerge.lookahead_on)
higherPercentRoc = request.security(
     syminfo.tickerid,
     higherTimeframe,
     100 * (close[1] / close[length + 1] - 1),
     lookahead = barmerge.lookahead_on)
higherValue = mode == "Raw Momentum" ? higherRawMomentum : higherPercentRoc
regimeValue = useHigherTimeframe ? higherValue : smoothedValue

// Visuals
zeroLine = hline(0, "Zero line", color = color.gray, linestyle = hline.style_dotted)
histogramColor = smoothedValue >= 0 ? color.teal : color.red
lineColor = smoothedValue >= 0 ? color.aqua : color.orange

plot(
     displayMode == "Histogram" ? smoothedValue : na,
     "Smoothed momentum histogram",
     color = histogramColor,
     style = plot.style_histogram,
     linewidth = 3)
plot(
     displayMode == "Line" ? smoothedValue : na,
     "Smoothed momentum line",
     color = lineColor,
     linewidth = 2)

backgroundColor = regimeValue >= 0 ? color.new(color.teal, 90) : color.new(color.red, 90)
bgcolor(showRegimeBackground ? backgroundColor : na, title = "Momentum regime")

// Alerts trigger from the chart-timeframe smoothed value.
alertcondition(ta.crossover(smoothedValue, 0), "Momentum crosses above zero", "Momentum crossed above zero on {{ticker}}")
alertcondition(ta.crossunder(smoothedValue, 0), "Momentum crosses below zero", "Momentum crossed below zero on {{ticker}}")
The first length bars cannot calculate a complete lookback, so Pine returns na there. That is expected. Once enough bars load, the plots begin normally.
The code uses input.int, input.string, and input.timeframe so the controls appear in the indicator settings panel. Keep length above zero because close[0] is valid but a zero-length change is always zero, which defeats the indicator.
Read the histogram without turning it into a signal machine
Start with the zero-line transition, not every color change.
- Cross above zero: Price is now above its close from
lengthbars ago. This is a bullish momentum condition. - Cross below zero: Price is below its lookback close. This is a bearish momentum condition.
- Rising positive bars: Upward momentum is accelerating relative to the smoothing period.
- Falling positive bars: Momentum remains positive but is decelerating. That is a warning, not an automatic short entry.
- Rising negative bars: Downward momentum is fading. Wait for the zero-line reclaim or your own price trigger before calling it a reversal.
A usable discretionary setup is simple: on a 15-minute chart, use 14-bar ROC smoothed with a 5-bar EMA. Mark a long candidate only when the reading crosses above zero and price closes above the 21 EMA. For a short candidate, invert both conditions. The moving average defines local direction; ROC confirms that price has actually traveled in that direction over the chosen window.
That is not the same as a fully tested strategy. To turn confirmation rules into orders, stops, and exits, use a strategy declaration and test realistic fills. The commission and slippage guide shows the Pine settings that keep a strategy test from assuming frictionless execution.
Tune the length and smoothing for the chart you trade
Two inputs determine almost all of this indicator's behavior.
| Trading use | Chart example | Lookback | EMA smoothing | What it emphasizes |
|---|---|---|---|---|
| Fast intraday confirmation | 1 to 5 minute | 8 | 3 | Quick impulse changes, more noise |
| Session swing confirmation | 15 to 60 minute | 14 | 5 | Balanced directional shift |
| Multi-day swing context | 4-hour to daily | 20 | 8 | Broader move, later turns |
| Slow trend regime | Daily | 50 | 10 | Persistent directional pressure |
Do not reduce both values at once when the plot feels slow. First lower the lookback from 14 to 10 while leaving smoothing at 5. That changes the comparison window. If the reading is still too delayed, reduce smoothing from 5 to 3. Changing one variable at a time shows you which adjustment created the new behavior.
ROC reacts violently around sharp gaps because the denominator is the prior close. That is mathematically correct. On earnings-sensitive equities or thin crypto pairs, a single gap can dominate the plot for several bars. A longer smoothing length can make the display easier to read, but it does not remove the underlying price event.
Add higher-timeframe confirmation without repainting it
The optional regime setting is useful when your execution chart is fast but you want the broader move on your side. For example, trade 5-minute zero-line crosses only while the confirmed 1-hour ROC is positive. Turn on Use confirmed higher-timeframe regime, keep higherTimeframe at 60, and use the background as a filter rather than an entry trigger.
The script requests the previous completed higher-timeframe bar with [1] and lookahead = barmerge.lookahead_on. This pairing avoids repeatedly changing the value of the still-open higher-timeframe bar across your lower-timeframe chart history. TradingView's guidance on other timeframes and data explains why higher-timeframe requests need deliberate offset and lookahead handling.
There is a tradeoff. You receive a stable, confirmed 1-hour reading only after that hour closes. That delay is the price of avoiding a historical plot that looks cleaner than the information available in real time. If you want a deeper explanation of the failure mode, read why Pine Script repaints.
Keep the alerts attached to the chart-timeframe smoothed line, as this script does. The higher timeframe supplies context. Making an alert depend on an unfinished higher-timeframe value is a common way to create alerts that appear inconsistent with the plot you review later.
Create zero-line alerts correctly
The two alertcondition() calls add named choices to TradingView's Create Alert dialog after the indicator is on the chart. Choose either Momentum crosses above zero or Momentum crosses below zero, then select Once Per Bar Close when you want the alert to wait for the active chart bar to finish.
Use once-per-bar-close alerts for a 15-minute or higher workflow. On very fast charts, once per bar can be appropriate when you deliberately want an intrabar heads-up, but understand that the close can still move the indicator back across zero before the candle ends. TradingView's alerts documentation covers alert conditions and trigger behavior.
A good operational rule is to write the alert message as the first step of your decision process, not as an order instruction. The default message identifies the ticker. You can expand it with a timeframe, setup name, or checklist reminder, then inspect price structure before acting.
Common mistakes that make momentum readings misleading
❌ Mistake: Comparing raw momentum across unrelated instruments. A raw value of 2 means two price units, so it has no shared scale between a low-priced stock, gold, and a currency pair.
✅ Do this: Use percent ROC for cross-market watchlists. Keep the same 14-bar ROC setting first, then compare the percentage readings on equivalent timeframes.
❌ Mistake: Calling a lower positive histogram bar bearish. It can simply mean price remains above its 14-bar reference but is rising less quickly.
✅ Do this: Separate direction from acceleration. Treat above or below zero as direction over the lookback, and the slope of the smoothed plot as acceleration or deceleration.
❌ Mistake: Enabling a 1-hour filter on a 5-minute chart and assuming every shaded bar had a final 1-hour value. Unoffset higher-timeframe data can change until the higher-timeframe candle closes.
✅ Do this: Keep the confirmed [1] higher-timeframe calculation shown in the script. You will get a delayed but stable regime reading rather than a misleading historical plot.
❌ Mistake: Treating a zero-line cross as a complete entry system. A cross doesn't define where a trade is wrong, how much is at risk, or when to take profit.
✅ Do this: Pair the indicator with a price condition and a predefined invalidation level. For example, require a 21 EMA alignment and place the invalidation beyond the most recent swing, then test the complete rule set.
Practical extensions once the base indicator works
The transparent version is the right baseline. Once you can explain each line, add one feature at a time and decide whether it improves decisions or merely adds color.
Threshold bands for a single symbol
Raw momentum does not have universal overbought or oversold levels. A 2-point move means different things across symbols. For a liquid instrument you trade repeatedly, inspect several months of the 14-bar ROC distribution and add symmetrical levels only after you know what is unusual for that market. Start with fixed bands such as +1% and -1% for testing, not as permanent defaults.
A faster and slower momentum pair
Plot 8-bar and 21-bar ROC in the same pane. The fast line identifies impulse. The slow line identifies the broader directional condition. Use the slow line above zero as a filter, then use the fast line's return above zero after a pullback as a timing event. This differs from blindly stacking indicators because both lines answer the same question at two defined horizons.
Color regimes tied to trend structure
The script's background turns teal or red based on the selected regime. You can tighten it by requiring both positive ROC and a close above a 50 EMA before showing a bullish background. That makes the regime more selective, but it also delays it. Compare the two versions bar by bar before you make the filter part of a plan.
Generating this without writing the code yourself
You can have HorizonAI generate the same Pine Script v6 indicator from a precise chat request, then edit the result in chat or in its browser-based Monaco editor. It generates and compile-checks Pine Script, so ask for the exact calculation and repaint behavior rather than a vague “momentum tool.” HorizonAI writes the code; you still add it to TradingView and decide how to use it.
Build a Pine Script v6 overlay=false indicator called “Transparent Momentum and ROC.” Add inputs for a 14-bar lookback, a mode switch between raw
close - close[length]momentum and percent ROC100 * (close / close[length] - 1), and 5-bar EMA smoothing. Plot the smoothed value as a selectable histogram or line, with teal or aqua above zero and red or orange below zero. Add a dotted zero line and alert conditions for chart-timeframe smoothed momentum crossing above and below zero. Add an optional 60-minute higher-timeframe regime background using only the previous confirmed higher-timeframe bar with request.security,[1], and lookahead_on so it does not repaint. Explain each input in code comments.
For a second iteration, ask it to add a 21 EMA price filter, fixed ROC bands, or a strategy version with explicit stop-loss and exit rules. The returned Pine code is working, compile-checked code you can refine through follow-up prompts.
FAQs
What is the difference between momentum and rate of change in Pine Script?
Momentum is the absolute difference between the current close and a prior close. Rate of change divides that difference by the prior close and expresses it as a percentage, making it easier to compare across different price levels.
Why does my momentum indicator show na on the first bars?
The script needs at least as many historical bars as its lookback length before close[length] exists. With a 14-bar lookback, na on the early bars is normal and resolves once enough history is available.
Is a momentum zero-line cross a buy or sell signal?
It is a change in direction relative to the chosen lookback, not a complete trade instruction. Combine it with a market-structure rule, a trend filter, and a defined invalidation level before testing it as a strategy.
Which setting is better, raw momentum or percent ROC?
Choose raw momentum when you focus on one instrument and its price units matter. Choose percent ROC when you compare instruments or want the same scale to remain meaningful after large price changes.
Final thoughts
A momentum indicator does not need a black-box formula to earn its place on a chart. With a 14-bar comparison, 5-bar smoothing, and a clear zero line, you can see whether price is gaining or losing ground over a window you chose deliberately.
Start with percent ROC in histogram mode and no higher-timeframe filter. Watch 30 to 50 zero-line transitions on one market and timeframe, record what price structure surrounded them, then add only the filter that solves a repeatable problem you observed.
Related articles
- Build a WaveTrend Oscillator in Pine Script v6 — Create a multi-stage oscillator for cyclical momentum analysis.
- Build a Squeeze Momentum Indicator in Pine Script v6 — Combine volatility compression with histogram momentum.
- Code a Combined RSI + MACD Indicator in Pine Script v6 — Put relative-strength and trend-momentum signals in one pane.
- Pine Script Repainting: Why It Happens and How to Fix It — Spot unstable historical signals before you trust them.
- Why Pine Script Alerts Fail, and the Fixes That Work — Troubleshoot alert conditions and TradingView setup.
- Simple Moving Average Crossover Strategy: Complete Guide — Use a moving-average direction filter around a momentum signal.
- Pine Script v6: Add Commission and Slippage to Strategies — Model realistic testing friction after you formalize rules.
- Pine Script Tutorial for Beginners: Build Your First TradingView Strategy in 10 Minutes — Learn the Pine workflow from indicator inputs to strategy logic.
Questions about momentum indicators in Pine Script? Join our Discord to discuss with other traders!