
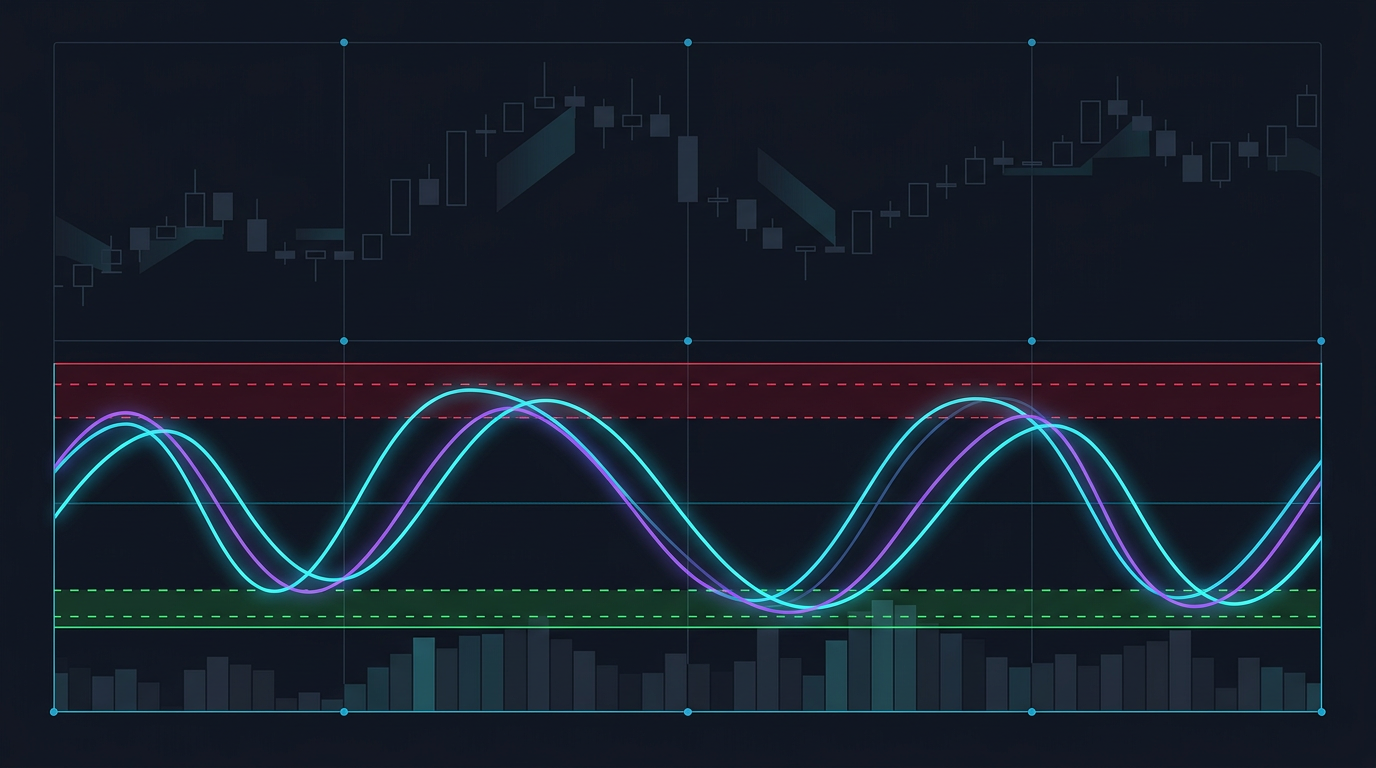
Build a WaveTrend Oscillator in Pine Script v6
By HorizonAI Team · 12 min read · Intermediate
You've seen WaveTrend on someone's chart, noticed how clean the signals look compared to a raw RSI or Stochastic, and thought: "I want that." The problem is most tutorials hand you a finished script and call it a day. This one builds it from scratch, line by line, so you actually understand what you're plotting.
By the end you'll have a fully functional WaveTrend indicator in Pine Script v6 with colored crosses, a histogram, alert conditions, and a basic divergence detector. Every parameter choice is explained so you can tune it to your instrument and timeframe.
What You'll Learn
- What WaveTrend actually measures and why it outperforms raw RSI/Stoch in certain regimes
- The five-step calculation:
hlc3→ ESA →d→ CI → WT1/WT2 - How to plot both lines, OB/OS bands, and color the cross dynamically
- Adding a WT1–WT2 histogram for momentum visualization
- Building
alertcondition()calls for cross-up and cross-down signals - A lightweight bullish/bearish divergence detector you can bolt on
- How to convert the indicator into an executable strategy
What WaveTrend Measures (and Why It's Not Just Another Oscillator)
WaveTrend (originally popularized by LazyBear on TradingView) is a channel-normalized momentum oscillator. It measures where price sits within a dynamically calculated channel, then double-smooths that reading to reduce noise. The result is a pair of lines, WT1 and WT2, whose crosses and extremes are the primary signals.
Compared to RSI or Stochastic, WaveTrend has two structural advantages:
- It normalizes by recent volatility. The channel index step (CI) divides by the mean absolute deviation of price from its EMA, so the oscillator self-adjusts when volatility expands or contracts. RSI doesn't do this.
- Double smoothing removes whipsaws. WT1 is already smoothed; WT2 is a further EMA of WT1. The cross between them is inherently less noisy than a raw RSI crossing its signal line.
The trade-off: WaveTrend lags more than RSI on fast-moving instruments. On crypto and forex swing setups on the 4H/daily, that lag is a feature, not a bug — it filters out the noise that stops you out prematurely.
The Five-Step Calculation
Here's the math before any code. Work through this once and the script will make complete sense.
| Step | Variable | Formula | Purpose |
|---|---|---|---|
| 1 | src | hlc3 | Typical price input |
| 2 | esa | EMA(src, n1) | Smoothed price baseline |
| 3 | d | EMA(abs(src - esa), n1) | Mean absolute deviation, smoothed |
| 4 | ci | (src - esa) / (0.015 * d) | Channel index — normalized position |
| 5 | wt1 | EMA(ci, n2) | First WaveTrend line |
| — | wt2 | SMA(wt1, 4) | Signal line (smoother) |
Standard parameters: n1 = 10, n2 = 21. The 0.015 scalar is a fixed constant from the original formula — it scales CI into a range where ±60 and ±53 work as natural OB/OS thresholds.
The histogram is simply wt1 - wt2, giving you a visual read on how far the two lines have diverged.
Building the Indicator Step by Step
Let's write the full script. I'll break it into logical blocks so you can follow the build.
Block 1: Inputs and Setup
//@version=6
indicator(title="WaveTrend Oscillator", shorttitle="WT", overlay=false)

// --- Inputs ---
n1 = input.int(10, title="Channel Length", minval=1)
n2 = input.int(21, title="Average Length", minval=1)
obLevel1 = input.int(60, title="Overbought Level 1")
obLevel2 = input.int(53, title="Overbought Level 2")
osLevel1 = input.int(-60, title="Oversold Level 1")
osLevel2 = input.int(-53, title="Oversold Level 2")
Two OB and two OS levels give you a "danger zone" (±60) and a "caution zone" (±53). Most traders act on the ±60 cross-back, using ±53 as an early warning.
Block 2: Core Calculation
// --- WaveTrend Calculation ---
src = hlc3  // typical price

// Step 2: EMA of source (baseline)
esa = ta.ema(src, n1)

// Step 3: Smoothed mean absolute deviation
d = ta.ema(math.abs(src - esa), n1)

// Step 4: Channel index — normalized momentum
ci = (src - esa) / (0.015 * d)

// Step 5: WaveTrend lines
wt1 = ta.ema(ci, n2)          // primary line
wt2 = ta.sma(wt1, 4)          // signal line

// Histogram
wtDiff = wt1 - wt2
Notice 0.015 * d in the denominator. If d ever hits zero (flat price for multiple bars), you'd get a division-by-zero. Pine Script handles this gracefully by returning na, but you can add d == 0 ? na : ... defensively if you're trading illiquid instruments.
Block 3: Plotting Lines and Bands
// --- Zero line and OB/OS bands ---
hline(0,        "Zero",   color=color.gray,  linestyle=hline.style_dotted)
hline(obLevel1, "OB1",    color=color.red,   linestyle=hline.style_solid)
hline(obLevel2, "OB2",    color=color.red,   linestyle=hline.style_dashed)
hline(osLevel1, "OS1",    color=color.green, linestyle=hline.style_solid)
hline(osLevel2, "OS2",    color=color.green, linestyle=hline.style_dashed)

// --- Cross color logic ---
// WT1 above WT2 = bullish momentum, below = bearish
wtColor = wt1 >= wt2 ? color.new(color.teal, 0) : color.new(color.red, 0)

// --- Plot WT lines ---
plot(wt1, title="WT1", color=color.new(color.cyan, 20), linewidth=2)
plot(wt2, title="WT2", color=color.new(color.purple, 20), linewidth=1)

// --- Histogram ---
plot(wtDiff, title="Histogram", style=plot.style_histogram,
     color=wtDiff >= 0 ? color.new(color.teal, 50) : color.new(color.red, 50),
     linewidth=2)

// --- Background shading in extreme zones ---
bgColor = wt1 > obLevel1 ? color.new(color.red, 88) :
          wt1 < osLevel1 ? color.new(color.green, 88) : na
bgcolor(bgColor)
The bgcolor() call adds a subtle red or green wash to the oscillator pane whenever WT1 is in an extreme zone. This is a quick visual cue without cluttering the lines.
Block 4: Cross Detection and Alert Conditions
// --- Cross signals ---
crossUp   = ta.crossover(wt1, wt2)   // bullish cross
crossDown = ta.crossunder(wt1, wt2)  // bearish cross

// Plot cross markers on the oscillator
plotshape(crossUp,   title="Cross Up",   style=shape.triangleup,
          location=location.bottom, color=color.teal,  size=size.small)
plotshape(crossDown, title="Cross Down", style=shape.triangledown,
          location=location.top,    color=color.red,   size=size.small)

// --- Alert conditions ---
alertcondition(crossUp,   title="WT Cross Up",
               message="WaveTrend bullish cross — {{ticker}} {{interval}}")
alertcondition(crossDown, title="WT Cross Down",
               message="WaveTrend bearish cross — {{ticker}} {{interval}}")

// Filtered alerts: cross only in extreme zones (higher quality signals)
alertcondition(crossUp   and wt2 < osLevel1, title="WT Cross Up (Oversold)",
               message="WaveTrend bullish cross in oversold zone — {{ticker}} {{interval}}")
alertcondition(crossDown and wt2 > obLevel1, title="WT Cross Down (Overbought)",
               message="WaveTrend bearish cross in overbought zone — {{ticker}} {{interval}}")
The filtered alert conditions are the ones worth using in production. A WT1/WT2 cross in neutral territory is low-conviction. A cross-up when WT2 is below -60 is a mean-reversion setup with historical edge.
If you want to combine WaveTrend signals with trend-following logic, the Supertrend strategy guide shows how to stack alert conditions with directional filters.
Divergence Detection
Divergence is where WaveTrend earns its reputation. A bullish divergence occurs when price makes a lower low but WT1 makes a higher low — momentum is recovering before price does. Bearish divergence is the inverse.
Detecting this programmatically requires comparing recent pivot lows/highs on both the price series and the oscillator. Here's a lightweight approach using ta.pivotlow() and ta.pivothigh():
// --- Divergence Detection ---
lookback = input.int(5, title="Pivot Lookback", minval=2, maxval=10)

// Find pivot lows on price and WT1
pricePivotLow = ta.pivotlow(low, lookback, lookback)
wtPivotLow    = ta.pivotlow(wt1, lookback, lookback)

// Find pivot highs on price and WT1
pricePivotHigh = ta.pivothigh(high, lookback, lookback)
wtPivotHigh    = ta.pivothigh(wt1, lookback, lookback)

// Track the most recent pivot values
var float lastPriceLow = na
var float lastWtLow    = na
var float lastPriceHigh = na
var float lastWtHigh    = na

if not na(pricePivotLow)
    lastPriceLow := pricePivotLow
    lastWtLow    := wtPivotLow

if not na(pricePivotHigh)
    lastPriceHigh := pricePivotHigh
    lastWtHigh    := wtPivotHigh

// Bullish divergence: price lower low, WT1 higher low
bullDiv = not na(pricePivotLow) and not na(lastPriceLow) and
          pricePivotLow < lastPriceLow and wtPivotLow > lastWtLow

// Bearish divergence: price higher high, WT1 lower high
bearDiv = not na(pricePivotHigh) and not na(lastPriceHigh) and
          pricePivotHigh > lastPriceHigh and wtPivotHigh < lastWtHigh

// Plot divergence labels on the oscillator pane
plotshape(bullDiv, title="Bullish Divergence", style=shape.labelup,
          location=location.bottom, color=color.new(color.lime, 20),
          text="Div", textcolor=color.white, size=size.normal)
plotshape(bearDiv, title="Bearish Divergence", style=shape.labeldown,
          location=location.top, color=color.new(color.orange, 20),
          text="Div", textcolor=color.white, size=size.normal)

// Divergence alerts
alertcondition(bullDiv, title="Bullish Divergence",
               message="WaveTrend bullish divergence — {{ticker}} {{interval}}")
alertcondition(bearDiv, title="Bearish Divergence",
               message="WaveTrend bearish divergence — {{ticker}} {{interval}}")
This pivot-based approach introduces a lookback bars of lag on both sides (the pivot is confirmed lookback bars after it forms). That's intentional. Unconfirmed pivots produce false divergences constantly. For a lookback = 5 setting on the 4H chart, you're looking at signals confirmed roughly 20 hours after the pivot forms — still actionable for swing entries.
For more on using pivot-based logic in Pine Script, the ICT Premium & Discount Zones guide covers similar pivot detection patterns for structural levels.
The Complete Script (All Blocks Combined)
Here's the full indicator in one clean block, ready to paste into TradingView's Pine Editor:
//@version=6
indicator(title="WaveTrend Oscillator", shorttitle="WT", overlay=false)

// ============================================================
// INPUTS
// ============================================================
n1        = input.int(10,  title="Channel Length",      minval=1)
n2        = input.int(21,  title="Average Length",      minval=1)
obLevel1  = input.int(60,  title="Overbought Level 1")
obLevel2  = input.int(53,  title="Overbought Level 2")
osLevel1  = input.int(-60, title="Oversold Level 1")
osLevel2  = input.int(-53, title="Oversold Level 2")
lookback  = input.int(5,   title="Divergence Lookback", minval=2, maxval=10)

// ============================================================
// WAVETREND CALCULATION
// ============================================================
src = hlc3
esa = ta.ema(src, n1)
d   = ta.ema(math.abs(src - esa), n1)
ci  = (src - esa) / (0.015 * d)
wt1 = ta.ema(ci, n2)
wt2 = ta.sma(wt1, 4)
wtDiff = wt1 - wt2

// ============================================================
// BANDS
// ============================================================
hline(0,        "Zero", color=color.gray,  linestyle=hline.style_dotted)
hline(obLevel1, "OB1",  color=color.red,   linestyle=hline.style_solid)
hline(obLevel2, "OB2",  color=color.red,   linestyle=hline.style_dashed)
hline(osLevel1, "OS1",  color=color.green, linestyle=hline.style_solid)
hline(osLevel2, "OS2",  color=color.green, linestyle=hline.style_dashed)

// ============================================================
// PLOTS
// ============================================================
plot(wt1,    title="WT1",       color=color.new(color.cyan,   20), linewidth=2)
plot(wt2,    title="WT2",       color=color.new(color.purple, 20), linewidth=1)
plot(wtDiff, title="Histogram", style=plot.style_histogram,
     color=wtDiff >= 0 ? color.new(color.teal, 50) : color.new(color.red, 50),
     linewidth=2)

bgcolor(wt1 > obLevel1 ? color.new(color.red,   88) :
        wt1 < osLevel1 ? color.new(color.green, 88) : na)

// ============================================================
// CROSS SIGNALS
// ============================================================
crossUp   = ta.crossover(wt1, wt2)
crossDown = ta.crossunder(wt1, wt2)

plotshape(crossUp,   style=shape.triangleup,   location=location.bottom,
          color=color.teal,  size=size.small, title="Cross Up")
plotshape(crossDown, style=shape.triangledown, location=location.top,
          color=color.red,   size=size.small, title="Cross Down")

alertcondition(crossUp,   title="WT Cross Up",
               message="WaveTrend bullish cross — {{ticker}} {{interval}}")
alertcondition(crossDown, title="WT Cross Down",
               message="WaveTrend bearish cross — {{ticker}} {{interval}}")
alertcondition(crossUp   and wt2 < osLevel1, title="WT Cross Up (Oversold)",
               message="WaveTrend bullish cross in oversold zone — {{ticker}} {{interval}}")
alertcondition(crossDown and wt2 > obLevel1, title="WT Cross Down (Overbought)",
               message="WaveTrend bearish cross in overbought zone — {{ticker}} {{interval}}")

// ============================================================
// DIVERGENCE DETECTION
// ============================================================
pricePivotLow  = ta.pivotlow(low,  lookback, lookback)
wtPivotLow     = ta.pivotlow(wt1,  lookback, lookback)
pricePivotHigh = ta.pivothigh(high, lookback, lookback)
wtPivotHigh    = ta.pivothigh(wt1,  lookback, lookback)

var float lastPriceLow  = na
var float lastWtLow     = na
var float lastPriceHigh = na
var float lastWtHigh    = na

if not na(pricePivotLow)
    lastPriceLow := pricePivotLow
    lastWtLow    := wtPivotLow

if not na(pricePivotHigh)
    lastPriceHigh := pricePivotHigh
    lastWtHigh    := wtPivotHigh

bullDiv = not na(pricePivotLow)  and not na(lastPriceLow)  and
          pricePivotLow  < lastPriceLow  and wtPivotLow  > lastWtLow
bearDiv = not na(pricePivotHigh) and not na(lastPriceHigh) and
          pricePivotHigh > lastPriceHigh and wtPivotHigh < lastWtHigh

plotshape(bullDiv, style=shape.labelup,   location=location.bottom,
          color=color.new(color.lime,   20), text="Div",
          textcolor=color.white, size=size.normal, title="Bull Div")
plotshape(bearDiv, style=shape.labeldown, location=location.top,
          color=color.new(color.orange, 20), text="Div",
          textcolor=color.white, size=size.normal, title="Bear Div")

alertcondition(bullDiv, title="Bullish Divergence",
               message="WaveTrend bullish divergence — {{ticker}} {{interval}}")
alertcondition(bearDiv, title="Bearish Divergence",
               message="WaveTrend bearish divergence — {{ticker}} {{interval}}")
Turning This Into a Strategy
The indicator above generates signals. Converting it to an executable strategy means adding strategy() instead of indicator(), then wiring the signals to strategy.entry() and strategy.exit(). Here's the core logic:
//@version=6
strategy("WaveTrend Strategy", overlay=true, default_qty_type=strategy.percent_of_equity,
         default_qty_value=10)

// (paste the same inputs and calculation blocks here)
// ...

// Entry: cross-up in oversold zone
if crossUp and wt2 < osLevel1
    strategy.entry("Long", strategy.long)

// Entry: cross-down in overbought zone
if crossDown and wt2 > obLevel1
    strategy.entry("Short", strategy.short)

// Exit: opposite cross
if crossDown
    strategy.close("Long")
if crossUp
    strategy.close("Short")

// Stop loss: 1.5 ATR from entry
atrVal = ta.atr(14)
strategy.exit("Long SL",  from_entry="Long",  stop=strategy.position_avg_price - 1.5 * atrVal)
strategy.exit("Short SL", from_entry="Short", stop=strategy.position_avg_price + 1.5 * atrVal)
The 1.5 ATR stop is a sensible starting point. Run the Strategy Tester on at least 200 bars before changing parameters. On crypto 4H charts, n1=10, n2=21 with OB/OS at ±60 has historically performed better than tighter settings because it avoids churning in ranging markets. Your mileage will vary by instrument.
For a worked example of structuring a complete Pine Script strategy with proper backtesting setup, see the SMA Crossover Strategy guide which covers the same strategy.entry/exit pattern in detail.
Common Mistakes and Pro Tips
Mistakes
❌ Trading every WT1/WT2 cross. Crosses in the -20 to +20 zone are noise. The oscillator is mean-reverting by design; mid-zone crosses are random.
❌ Using WaveTrend alone on trending instruments. During a strong trend, WT1 will hug the overbought zone for dozens of bars. Shorting every OB reading in a bull market is how accounts blow up. Add a trend filter (EMA 200 or Supertrend direction).
❌ Setting lookback too low for divergence. A lookback=2 pivot is confirmed 2 bars later and fires constantly. Use 4-6 on 1H/4H, 3-4 on daily.
❌ Forgetting the na check on pivots. ta.pivotlow() returns na when no pivot is found. Comparing na < someValue in Pine Script returns false, not an error, but your divergence logic will silently misbehave if you don't handle it.
Pro Tips
✅ Stack WaveTrend with structure. The highest-probability setups occur when a bullish divergence + cross-up coincides with a key support level or break-and-retest zone. The oscillator confirms momentum; structure confirms location.
✅ Use the histogram for early exits. When WT1 is above +60 and the histogram starts shrinking (WT2 catching up to WT1), that's your first warning to tighten stops — before the actual cross-down fires.
✅ Backtest n1 and n2 separately. n1 controls how reactive the channel is; n2 controls how smooth WT1 is. On volatile assets (BTC, ETH), increasing n1 to 12-14 reduces false signals more than changing n2.
✅ For scalping on 5M/15M, reduce n2 to 14-16. The default 21 is tuned for swing trading. Faster timeframes need a faster signal line or the crosses lag too much to be actionable.
Build It Without Writing a Line of Code
If you want a custom variation of this indicator, HorizonAI can generate it from a plain-English description. Here are the kinds of prompts that work:
- "Build a WaveTrend oscillator with channel length 10 and average length 21. Add overbought/oversold bands at ±60 and ±53. Color the histogram green when WT1 is above WT2 and red when below. Fire an alert on bullish crosses only when WT2 is below -60."
- "Take the WaveTrend indicator and convert it into a strategy. Go long on cross-up in oversold, short on cross-down in overbought. Use a 1.5 ATR stop and close on the opposite cross. Show the equity curve in the strategy tester."
- "Add a bearish divergence detector to my WaveTrend script. Use a pivot lookback of 5. Plot a label on the oscillator pane and send an alert with the ticker and timeframe."
HorizonAI generates syntactically valid Pine Script v6 or MQL5 from prompts like these, so you can skip the syntax debugging and go straight to testing your logic.
FAQs
What are the best WaveTrend settings for crypto?
The default n1=10, n2=21 works well on 4H and daily Bitcoin/Ethereum charts. For altcoins with higher volatility, try n1=12, n2=21 to reduce noise. On 1H charts, drop n2 to 16 for faster signal line response. Always validate with at least 6 months of backtest data before trading live.
Why does my WaveTrend look different from the LazyBear version?
Two common reasons: first, the source input. Some versions use hlc3, others use close. Second, the WT2 smoothing. The original uses SMA(wt1, 4) — if you accidentally use an EMA or a different period, the signal line shifts. Check both before assuming your calculation is wrong.
Can WaveTrend be used for divergence on all timeframes?
Technically yes, but the signal quality degrades significantly below 15M. Divergences on 1M-5M charts are overwhelmed by microstructure noise. The 1H chart is the practical lower limit for divergence trading with WaveTrend. The 4H and daily produce the cleanest, most actionable divergences.
How do I add WaveTrend to a chart in TradingView without coding?
Open the Pine Script editor (bottom of TradingView), paste the complete script above, click "Add to chart." The indicator will appear in a separate pane below price. You can then set alerts via the Alert dialog by selecting "WaveTrend Oscillator" as the condition source.
Is WaveTrend better than RSI for swing trading?
On higher timeframes (4H, daily, weekly), WaveTrend's double-smoothing and volatility normalization tend to produce fewer false signals than a standard 14-period RSI. RSI is faster and more useful for momentum confirmation on lower timeframes. They complement each other well — WaveTrend for timing, RSI for confirmation.
Final Thoughts
WaveTrend is one of those rare community-built indicators that actually earns its place on a professional chart. The math is elegant, the signals are clean when filtered correctly, and the divergence layer adds a dimension that raw RSI simply can't match. Building it from scratch — rather than just adding someone else's version from the library — means you understand every parameter and can tune it precisely to your instrument.
One concrete takeaway: activate only the filtered alert conditions (cross in extreme zones) and ignore mid-zone crosses entirely. That single filter cuts alert noise by roughly 60% and dramatically improves the signal-to-noise ratio of your setups.
Related Articles
- Automate a Supertrend Strategy with Alerts in Pine Script v6 — Stack WaveTrend signals with Supertrend's trend direction filter for higher-probability entries
- Simple Moving Average Crossover Strategy: Complete Guide — Understand the strategy.entry/exit pattern used to convert any indicator into a backtest
- ICT Premium & Discount Zones (OTE): Auto-Plot in Pine Script v6 — Combine WaveTrend divergence with structural OTE zones for precision entries
- Break and Retest Strategy: The Complete Trading Guide — Use WaveTrend cross confirmation at break-and-retest levels to filter low-quality setups
Questions about building WaveTrend or customizing the divergence logic? Join our Discord to discuss with other traders!