
EMA Clouds
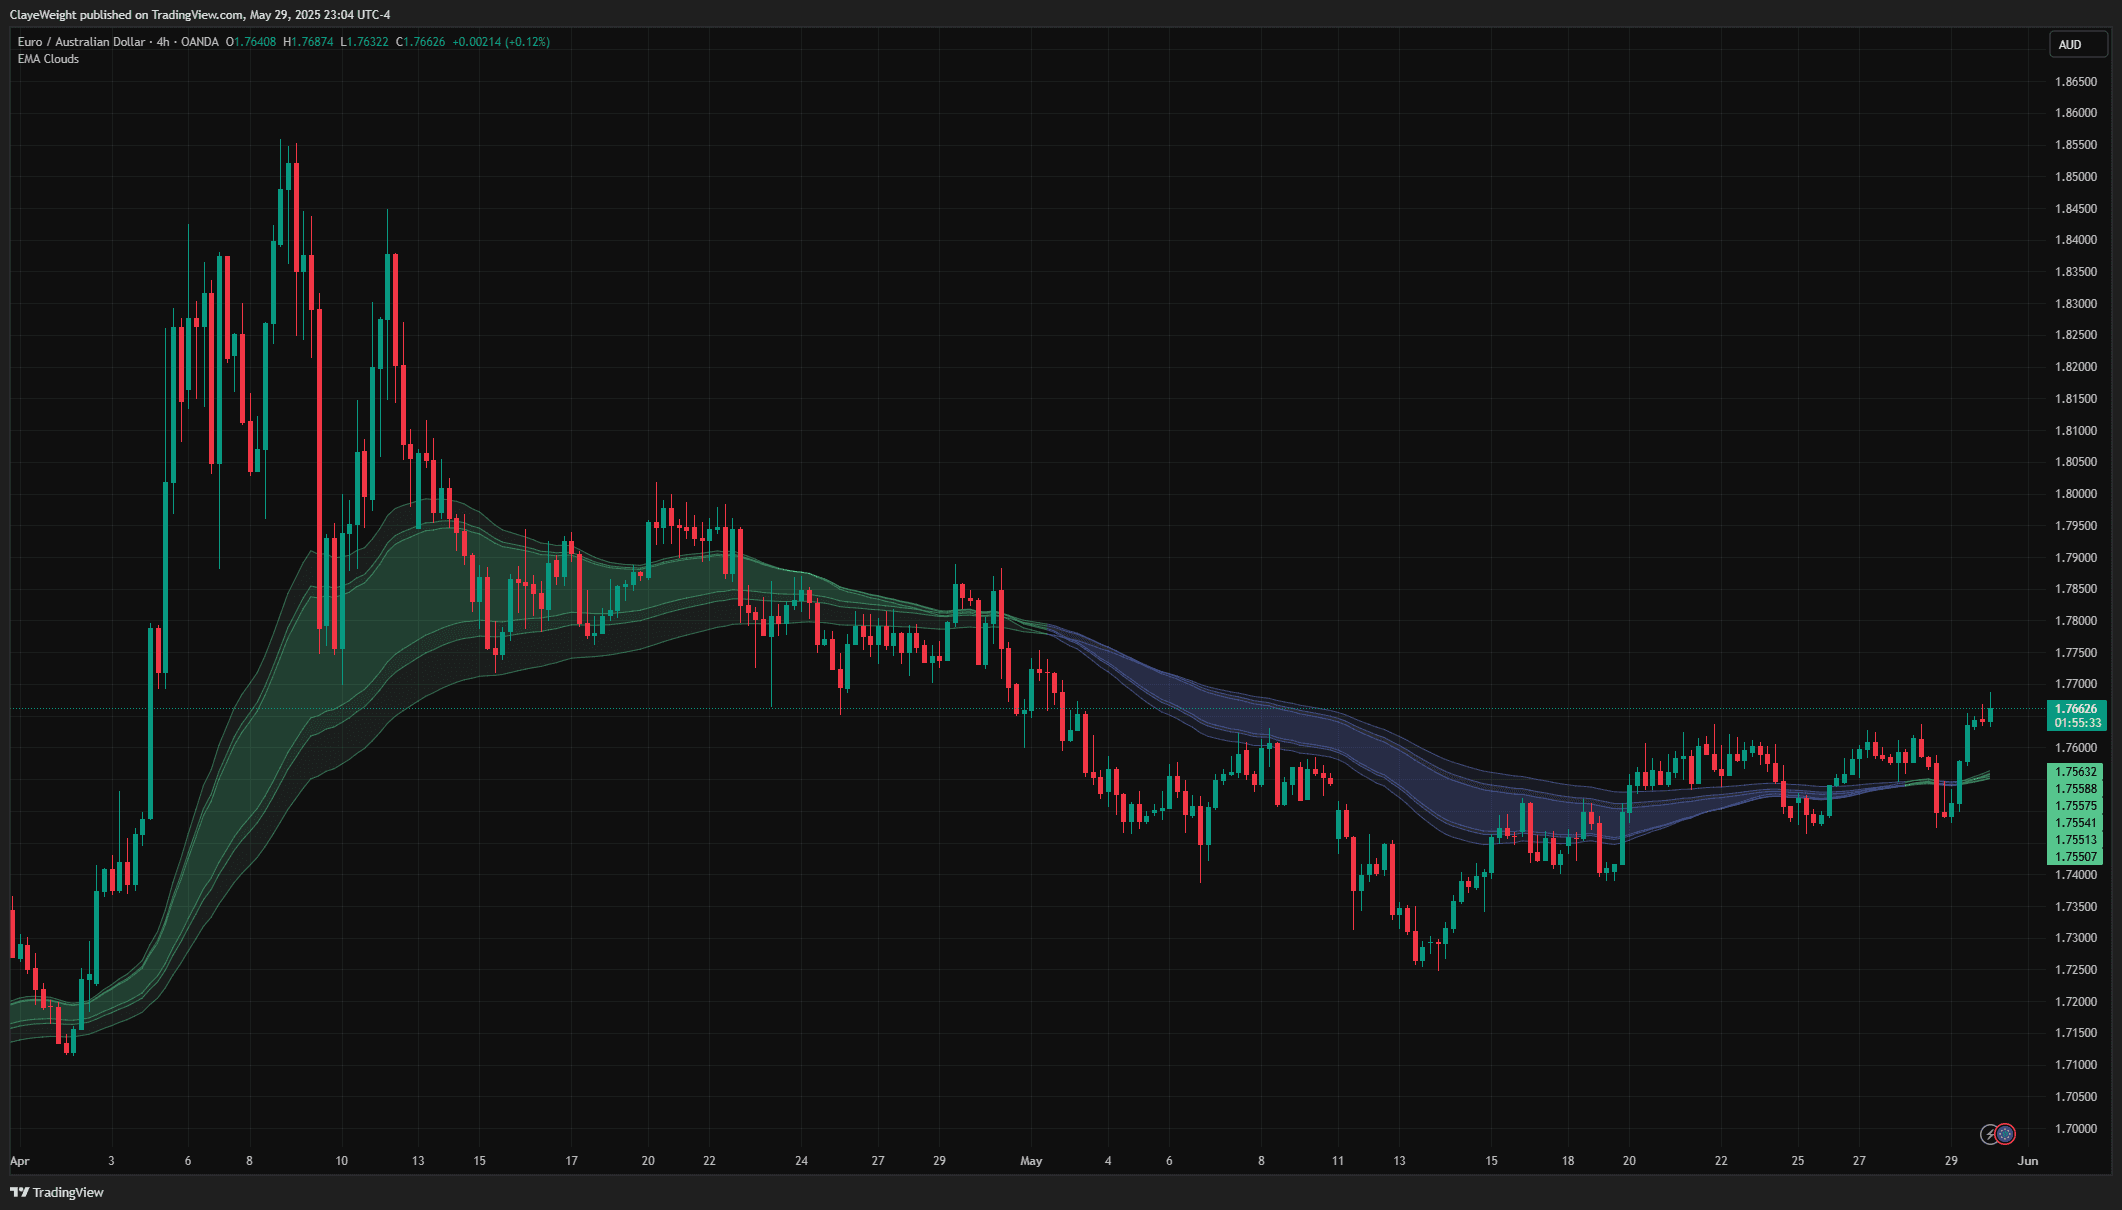
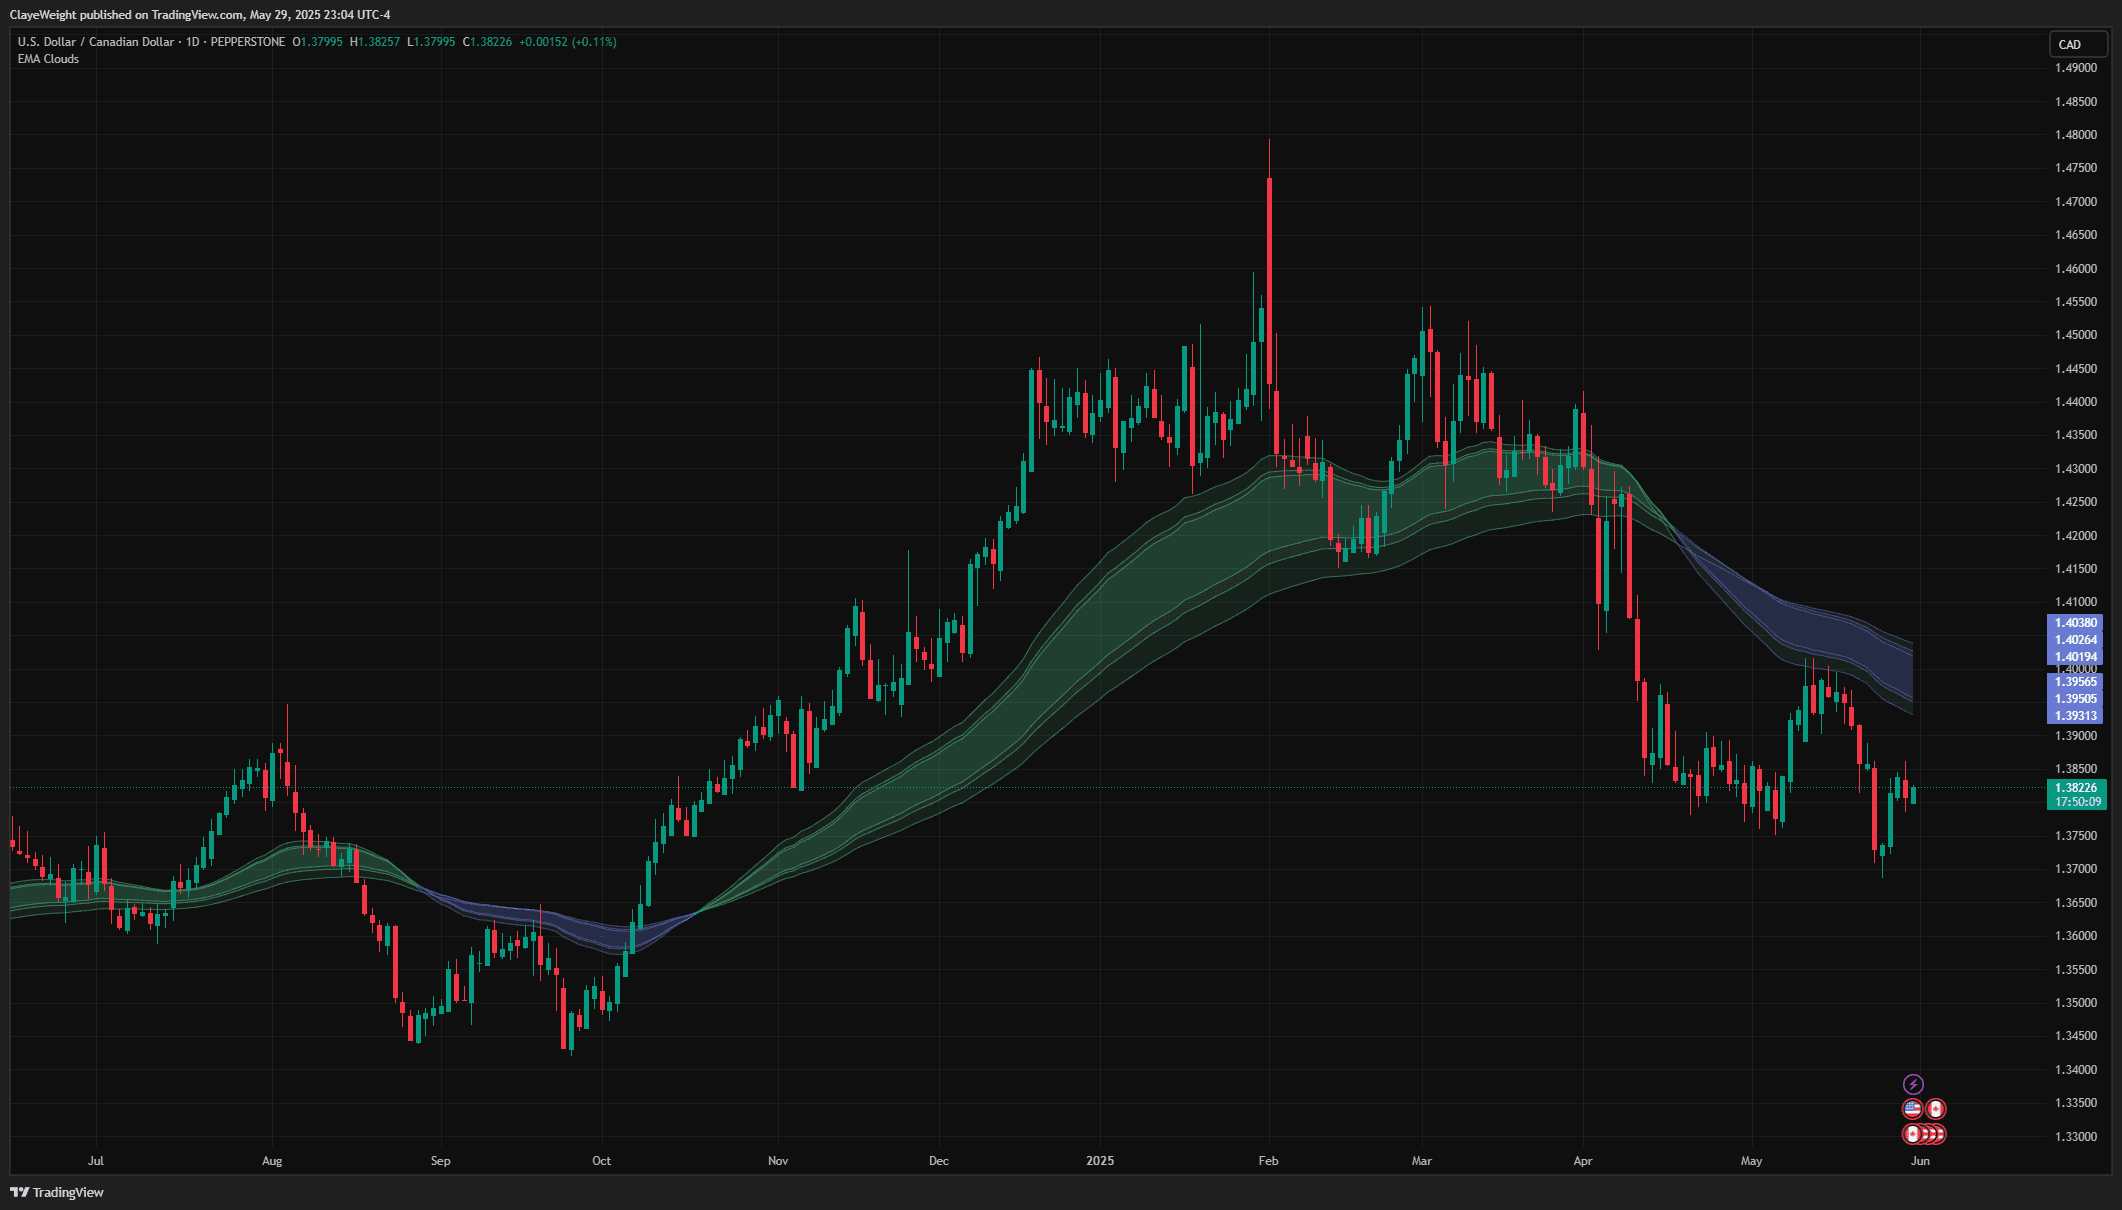
Visualize trend direction with stunning EMA ribbon clouds. The cloud fills between fast and slow EMAs, changing color based on trend direction. Includes crossover signals and trend strength based on cloud thickness.

What's Included
How EMA Clouds works
An EMA cloud is built from a group of exponential moving averages rather than a single line. The space between a faster EMA and a slower EMA is filled in with colour, turning two separate lines into a visible band or 'ribbon' that reacts to price faster than a simple moving average because EMAs weight recent candles more heavily.
The fill colour communicates trend direction at a glance: when the faster EMA sits above the slower one the cloud reads bullish, and when it flips underneath the cloud reads bearish. The moment the two EMAs cross and the fill inverts is treated as a potential shift in short-term trend, which is why traders watch crossovers as an early bias signal.
Cloud thickness carries information too. A wide gap between the fast and slow EMAs suggests strong, expanding momentum in one direction, while a thin or repeatedly pinching cloud points to a slowing, indecisive market where the moving averages are converging and price is likely ranging.
When to use it
- Establishing a quick directional bias on a trending instrument without cluttering the chart with multiple raw MA lines.
- Using the cloud as a dynamic support or resistance area that price pulls back into during an established trend.
- Watching for crossovers and colour flips as an early heads-up that a trend may be losing control.
- Layering it with a higher-timeframe view so you only take signals aligned with the larger trend.
When it's not the right tool
- In tight, choppy ranges where the fast and slow EMAs repeatedly cross, producing whipsaw signals and false flips.
- As a standalone entry trigger without price-action or structure confirmation, since moving averages lag turning points.
- Around scheduled high-impact news, where sudden gaps can invalidate any moving-average read instantly.
Source Code Preview
Get the full PineScript v6 source code—use it as a foundation and build on top of it with HorizonAI.
Frequently asked questions
How is an EMA cloud different from a single moving average?
A single moving average gives you one line and a simple above/below read. A cloud uses at least two EMAs and fills the space between them, so you get direction from the colour, an early warning from crossovers, and a rough sense of momentum strength from how thick or thin the band becomes.
Does a colour flip guarantee the trend has reversed?
No. A flip signals that the shorter EMA has crossed the longer one, which often precedes a shift but also fires frequently in sideways conditions. Treat it as a prompt to investigate, confirm with structure or higher-timeframe context, and manage risk rather than as a certainty.
What does cloud thickness actually tell me?
Thickness reflects the separation between the fast and slow EMAs, which tends to widen when momentum is strong and one-directional, and pinch when momentum fades and the market is coiling. It is a relative gauge, not a precise measurement, so read it in context of recent behaviour.
Can I change how many EMAs the cloud uses?
The general concept works with different EMA combinations, and with HorizonAI you can adjust the make-up of the ribbon to suit your timeframe and style. Faster settings react sooner but produce more noise; slower settings are steadier but lag more.
Related Scripts
 Pro
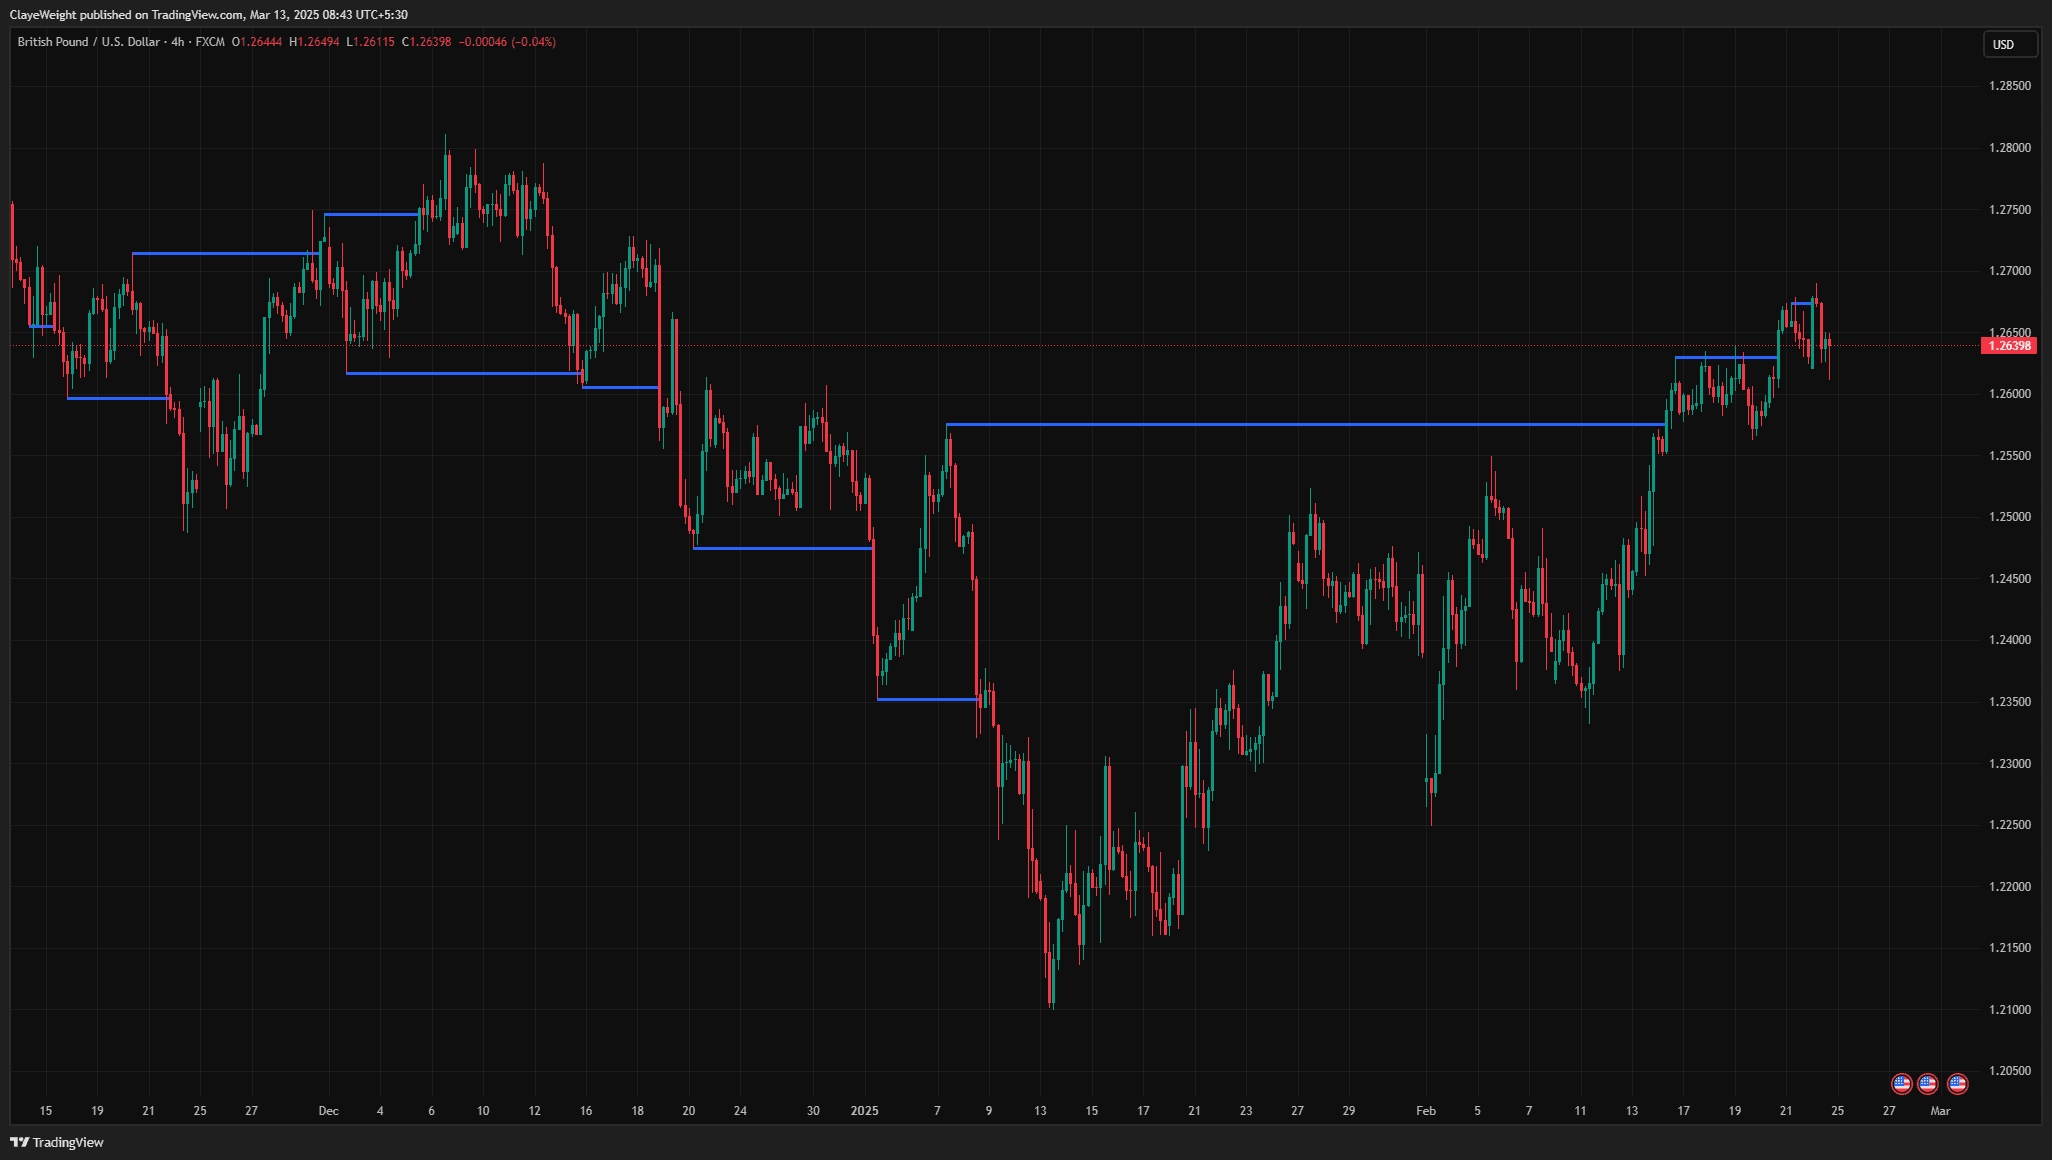
ProMarket Structure
Automatically maps swing highs and lows with break of structure detection.
 Pro
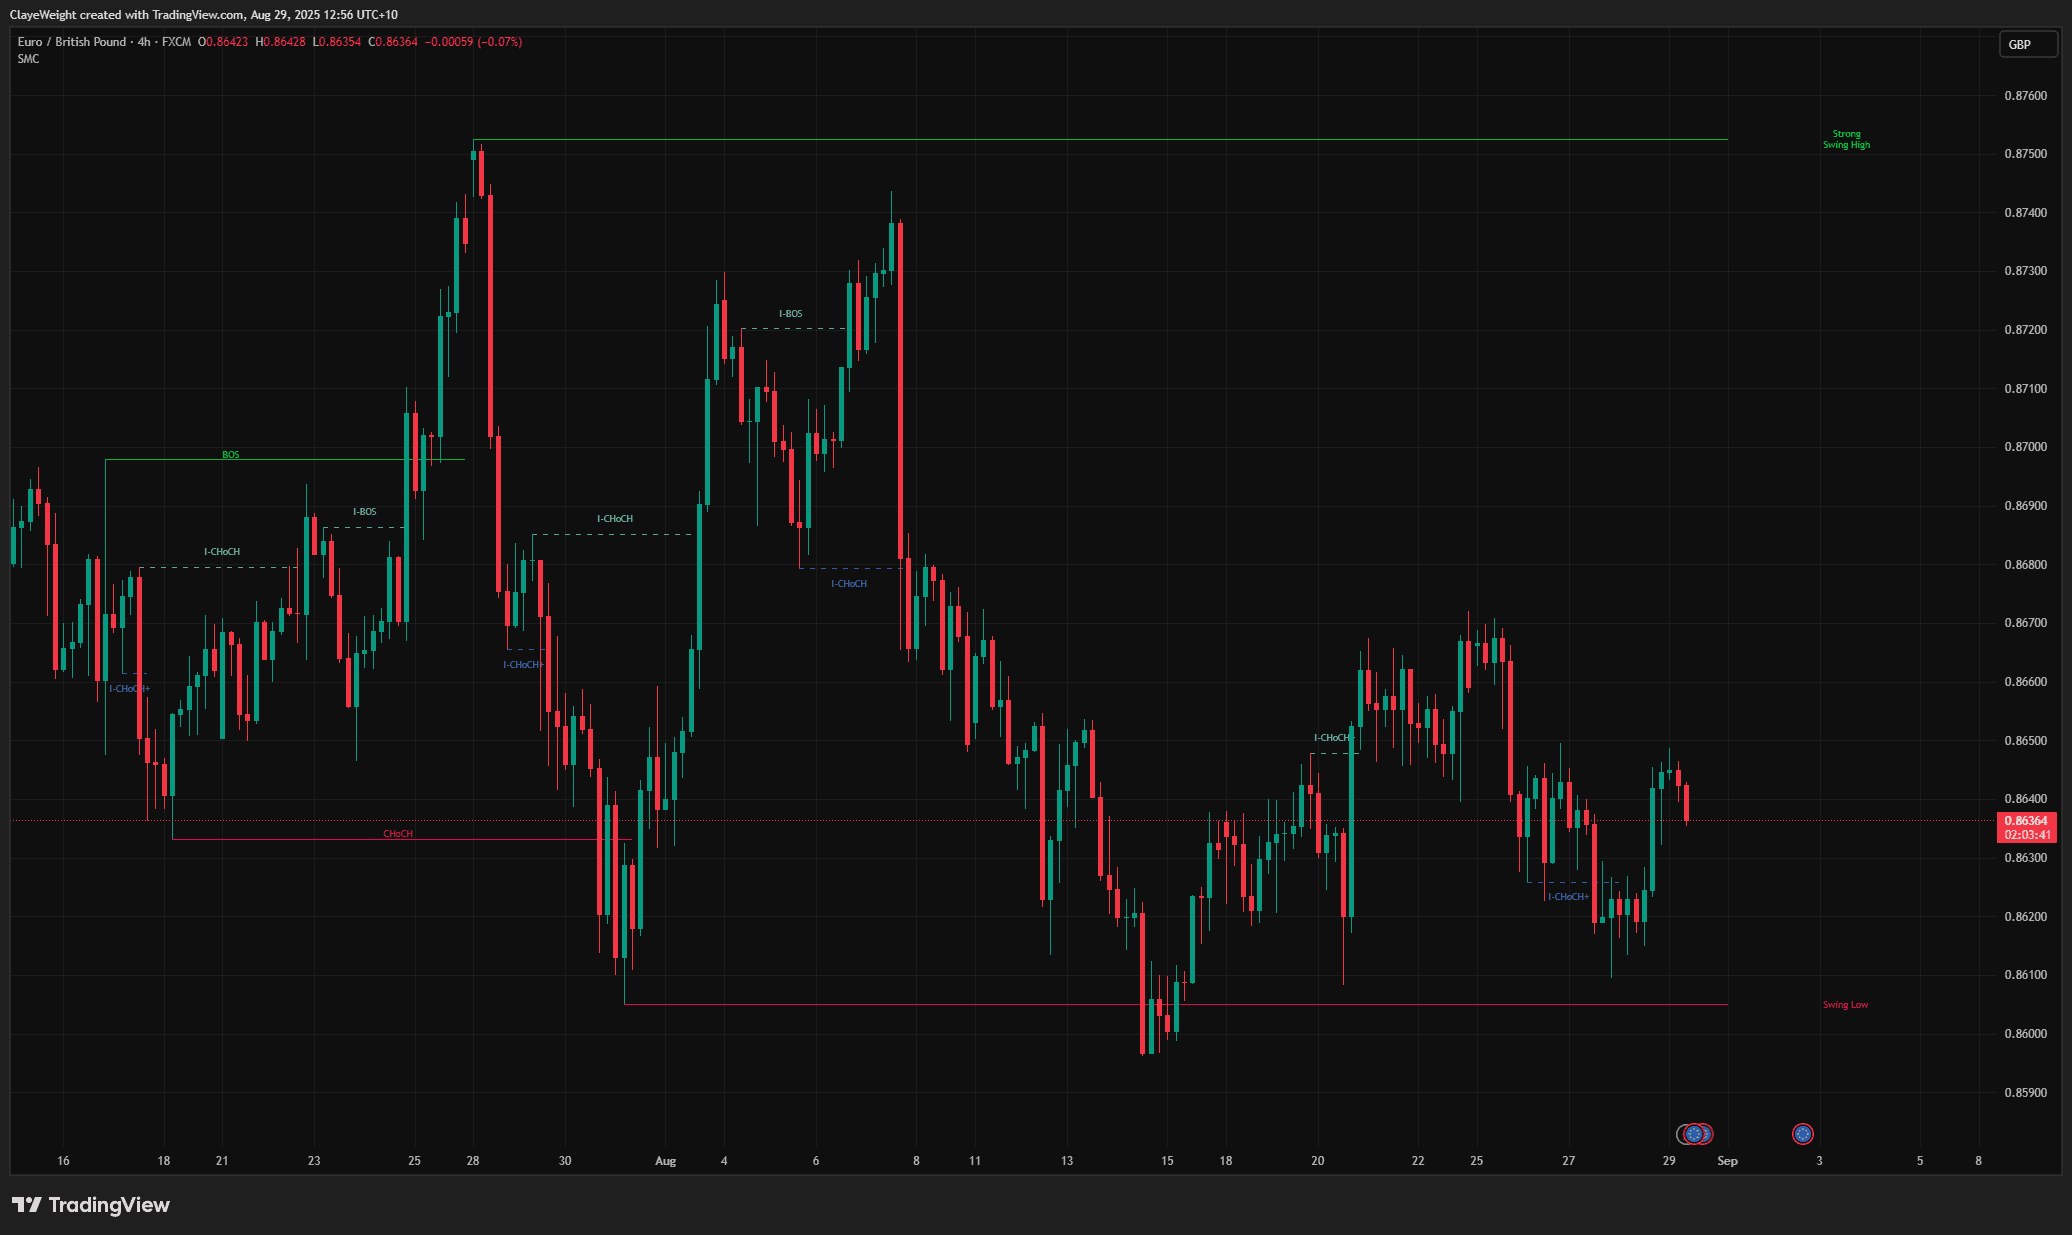
ProSMC Market Structure Pro
Advanced Smart Money Concepts with internal and swing structure mapping.
 Free
FreeLiquidity Levels
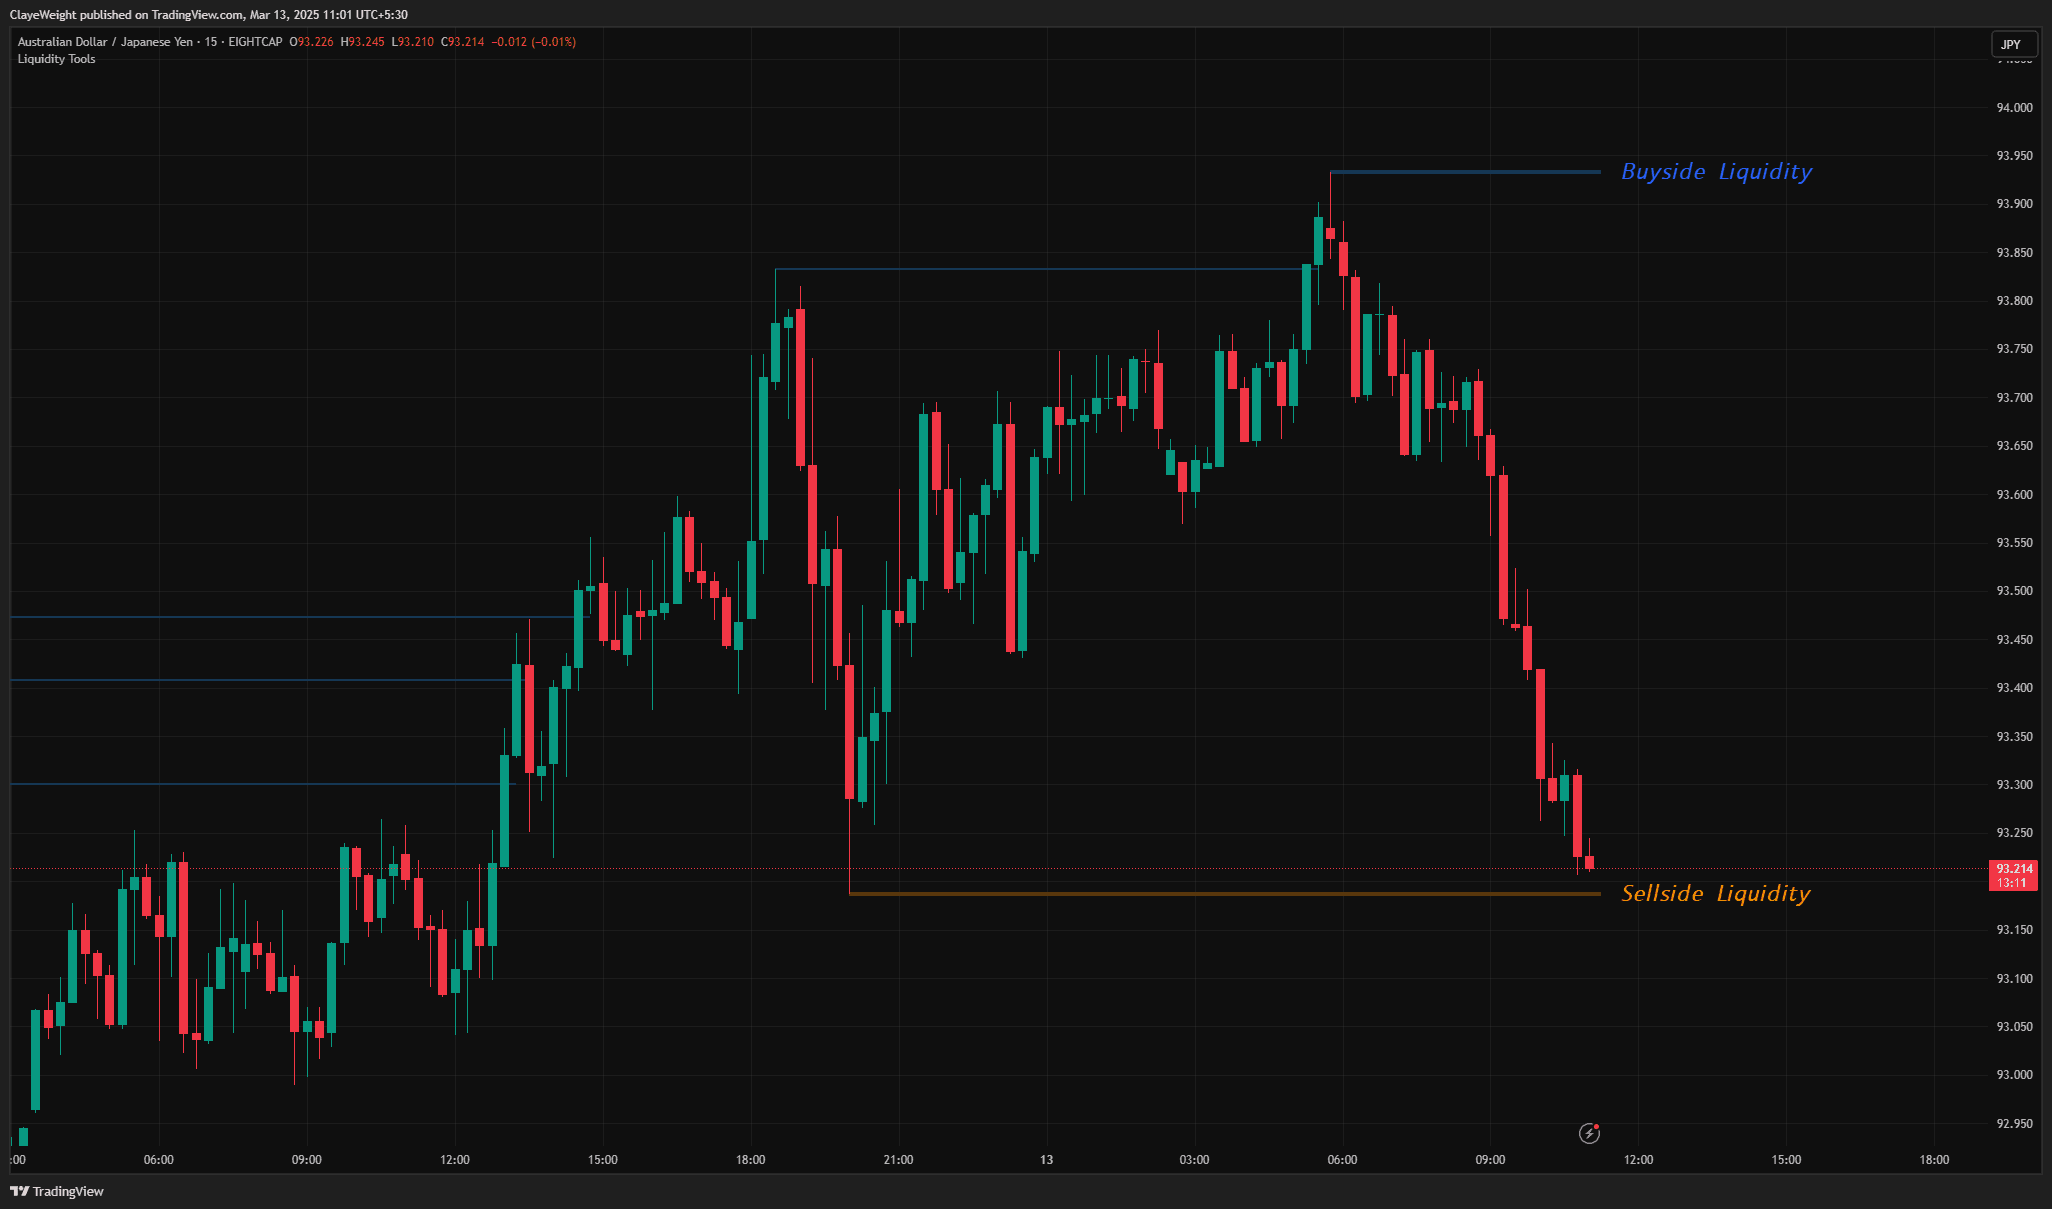
A comprehensive suite designed to identify and track institutional liquidity zones, stop hunts, and more.
Get access to all 23+ scripts
Full source code, alert templates, and the perfect base to build on with HorizonAI. Join 10,000+ traders.