
Head & Shoulders Pattern
Classic pattern recognition automated. Detects both head & shoulders tops and inverse H&S bottoms with neckline projection. Includes measured move targets and pattern validation scoring.
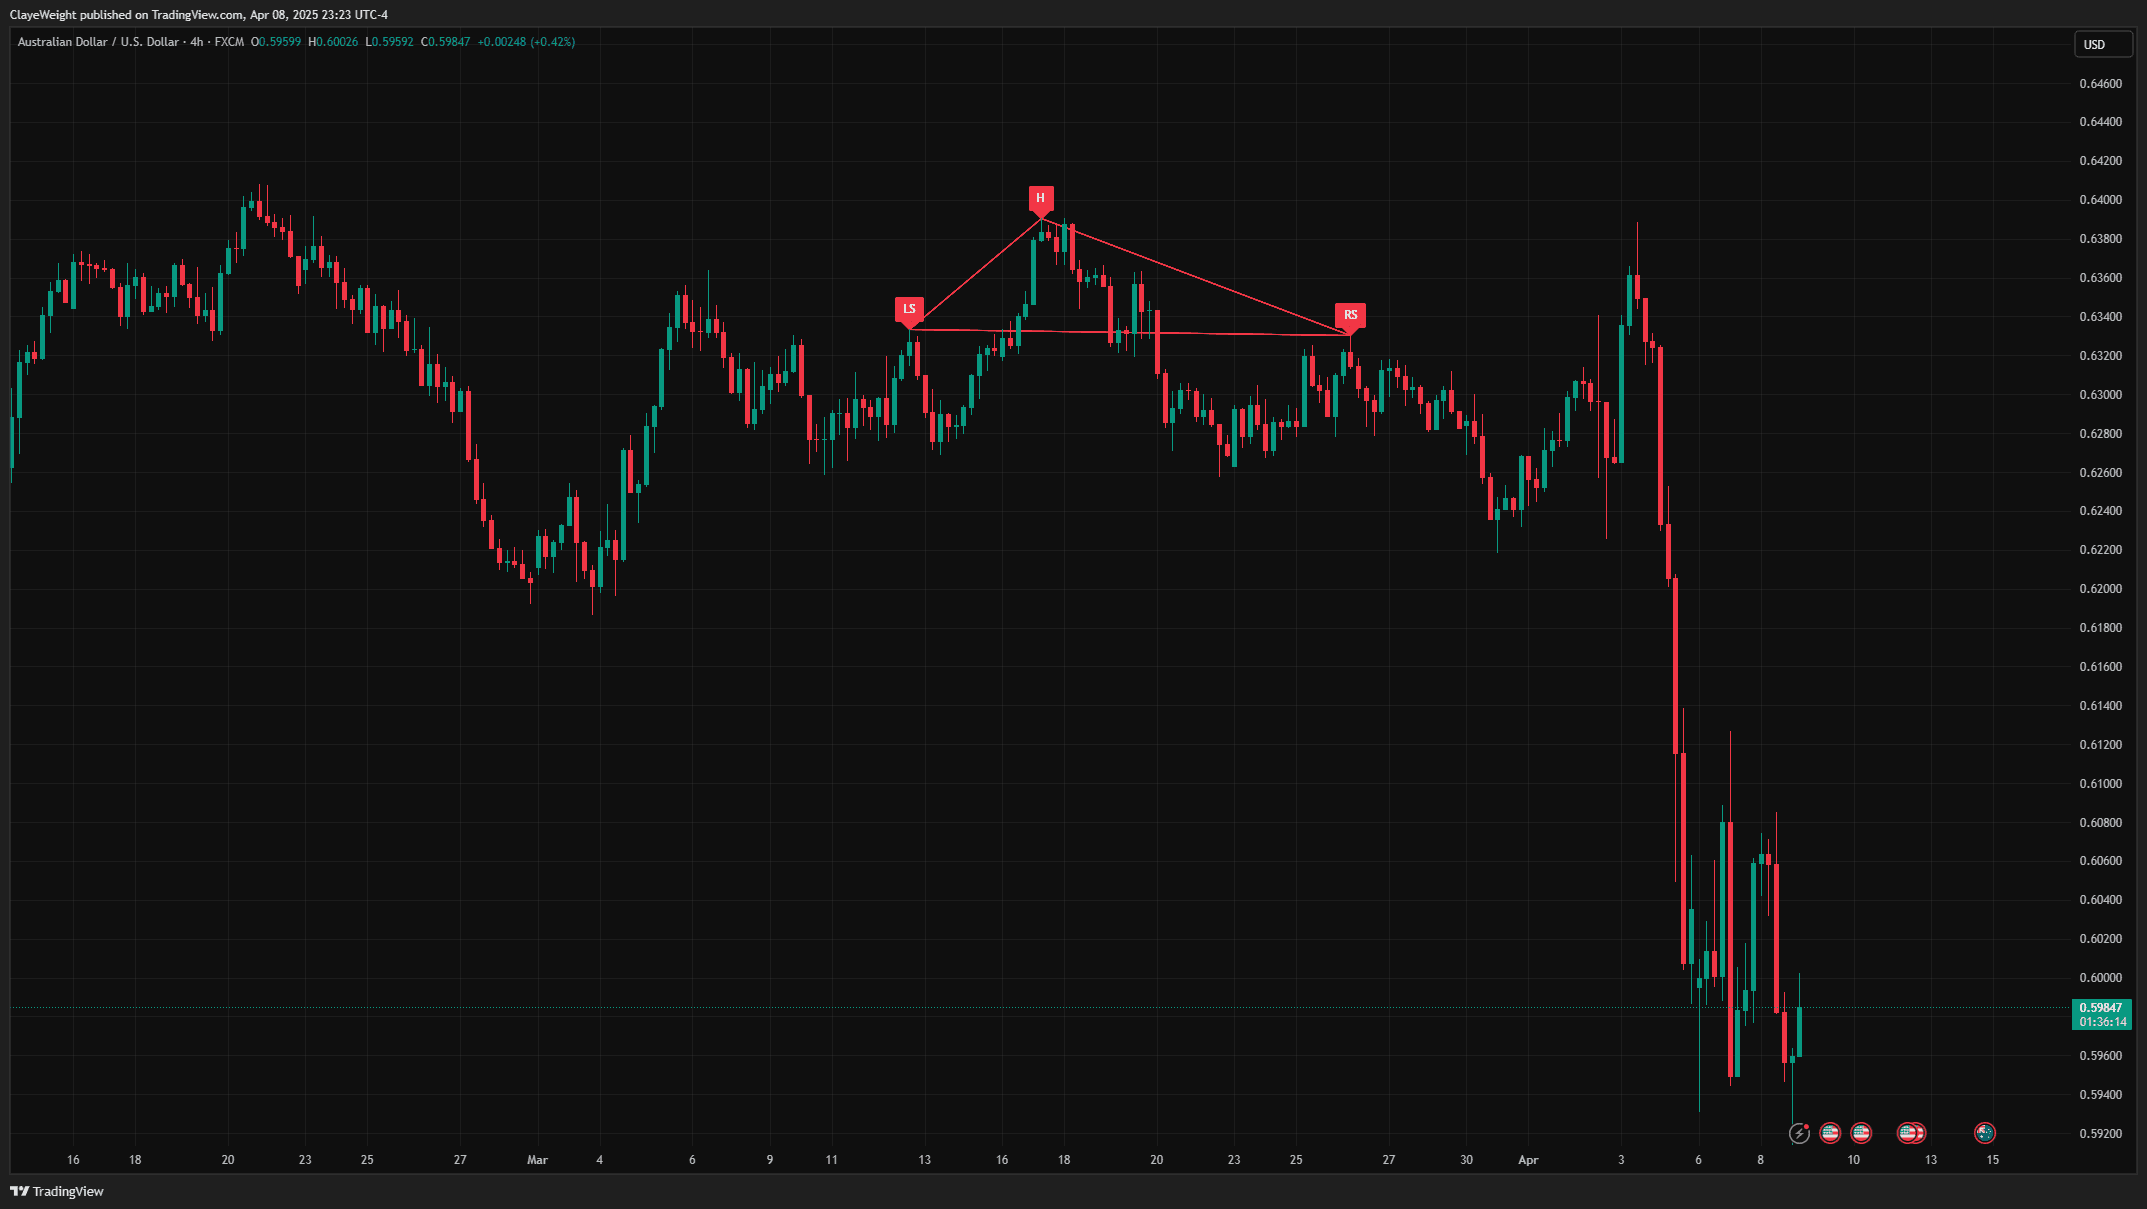
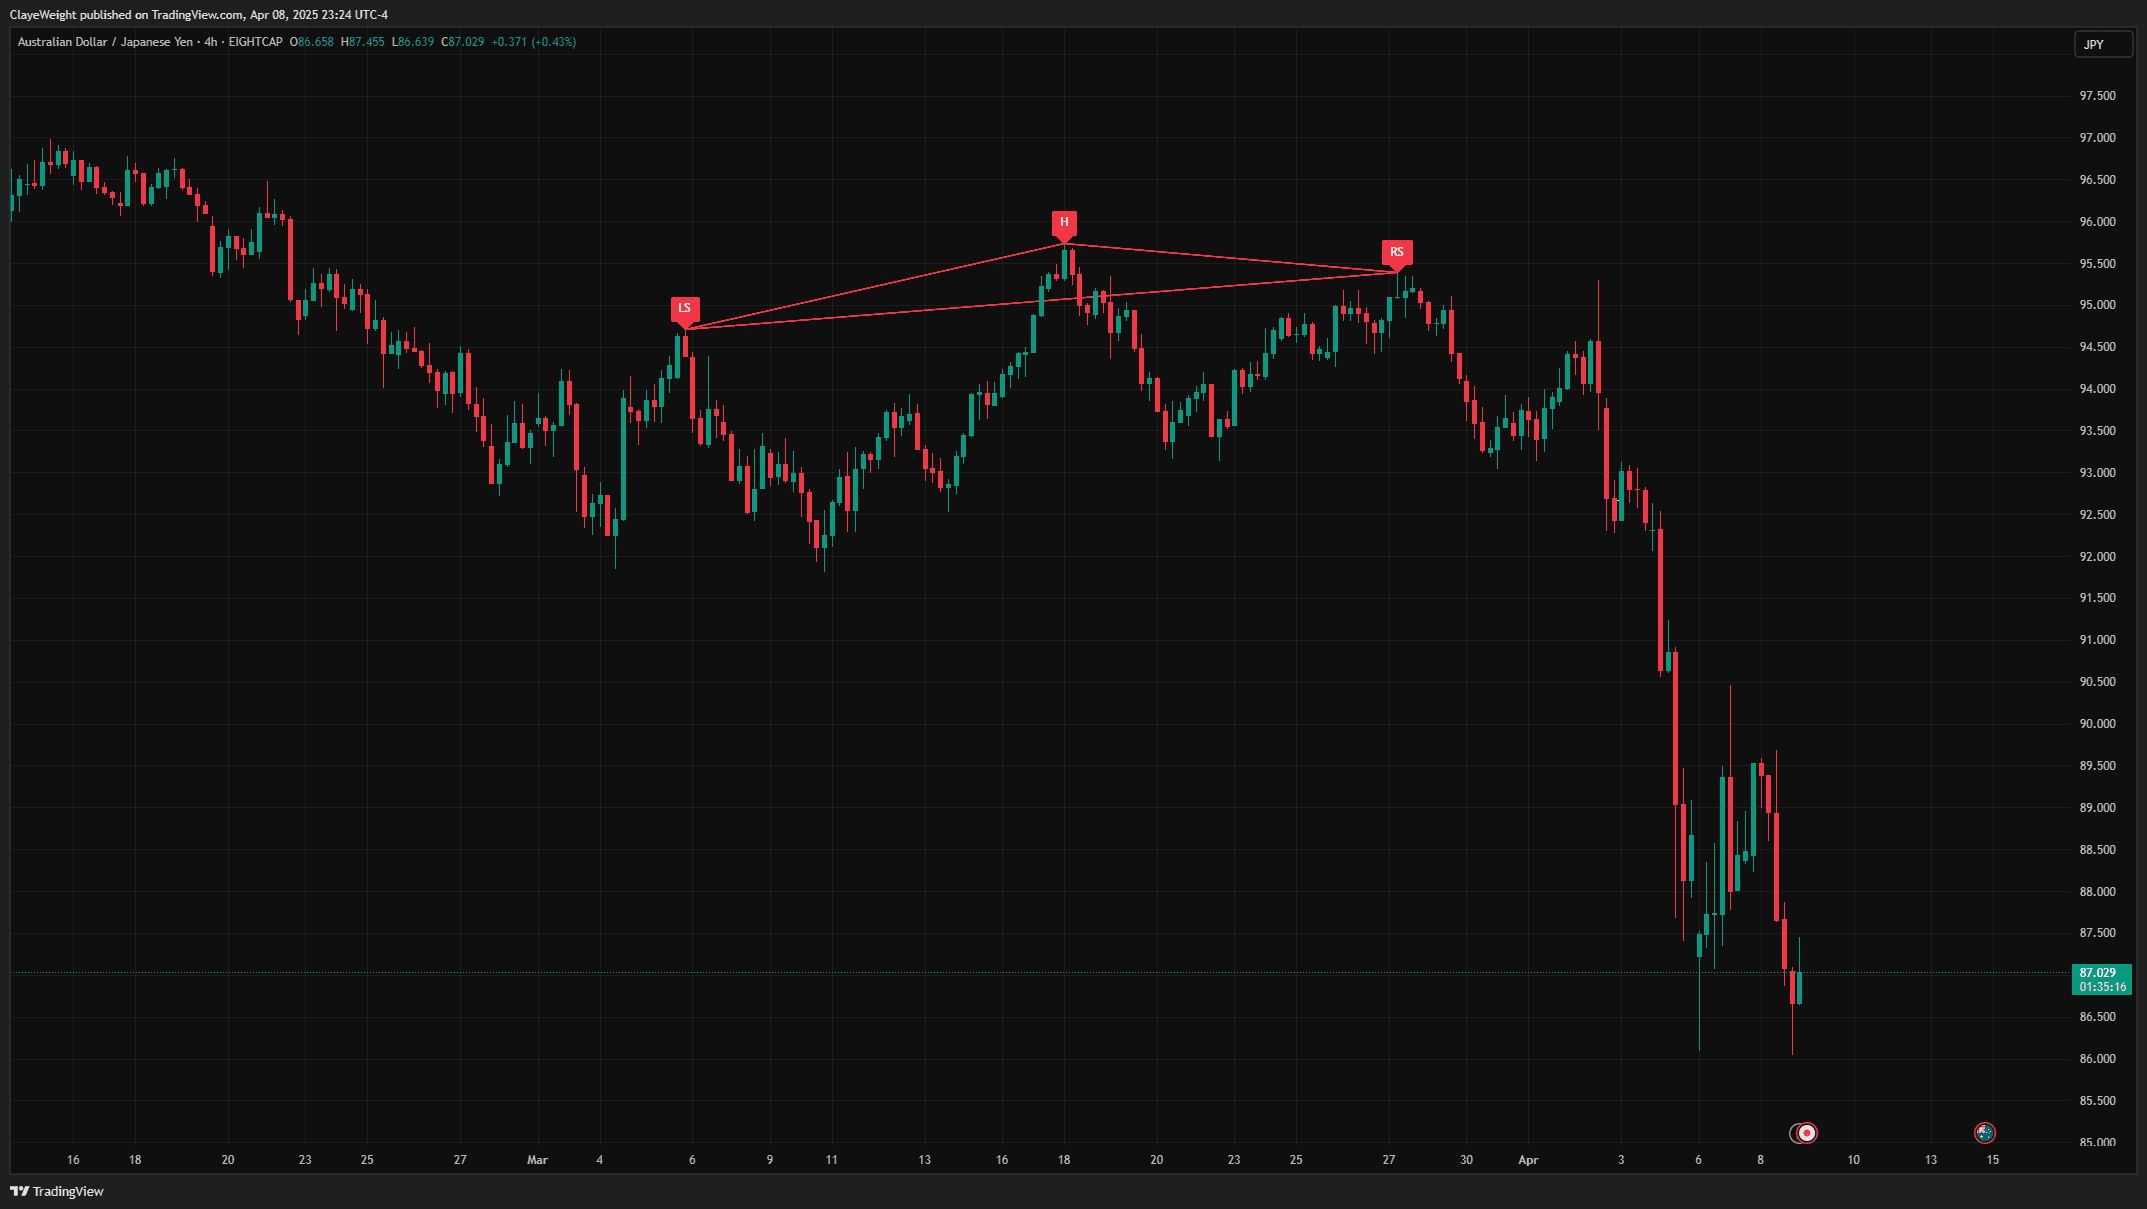
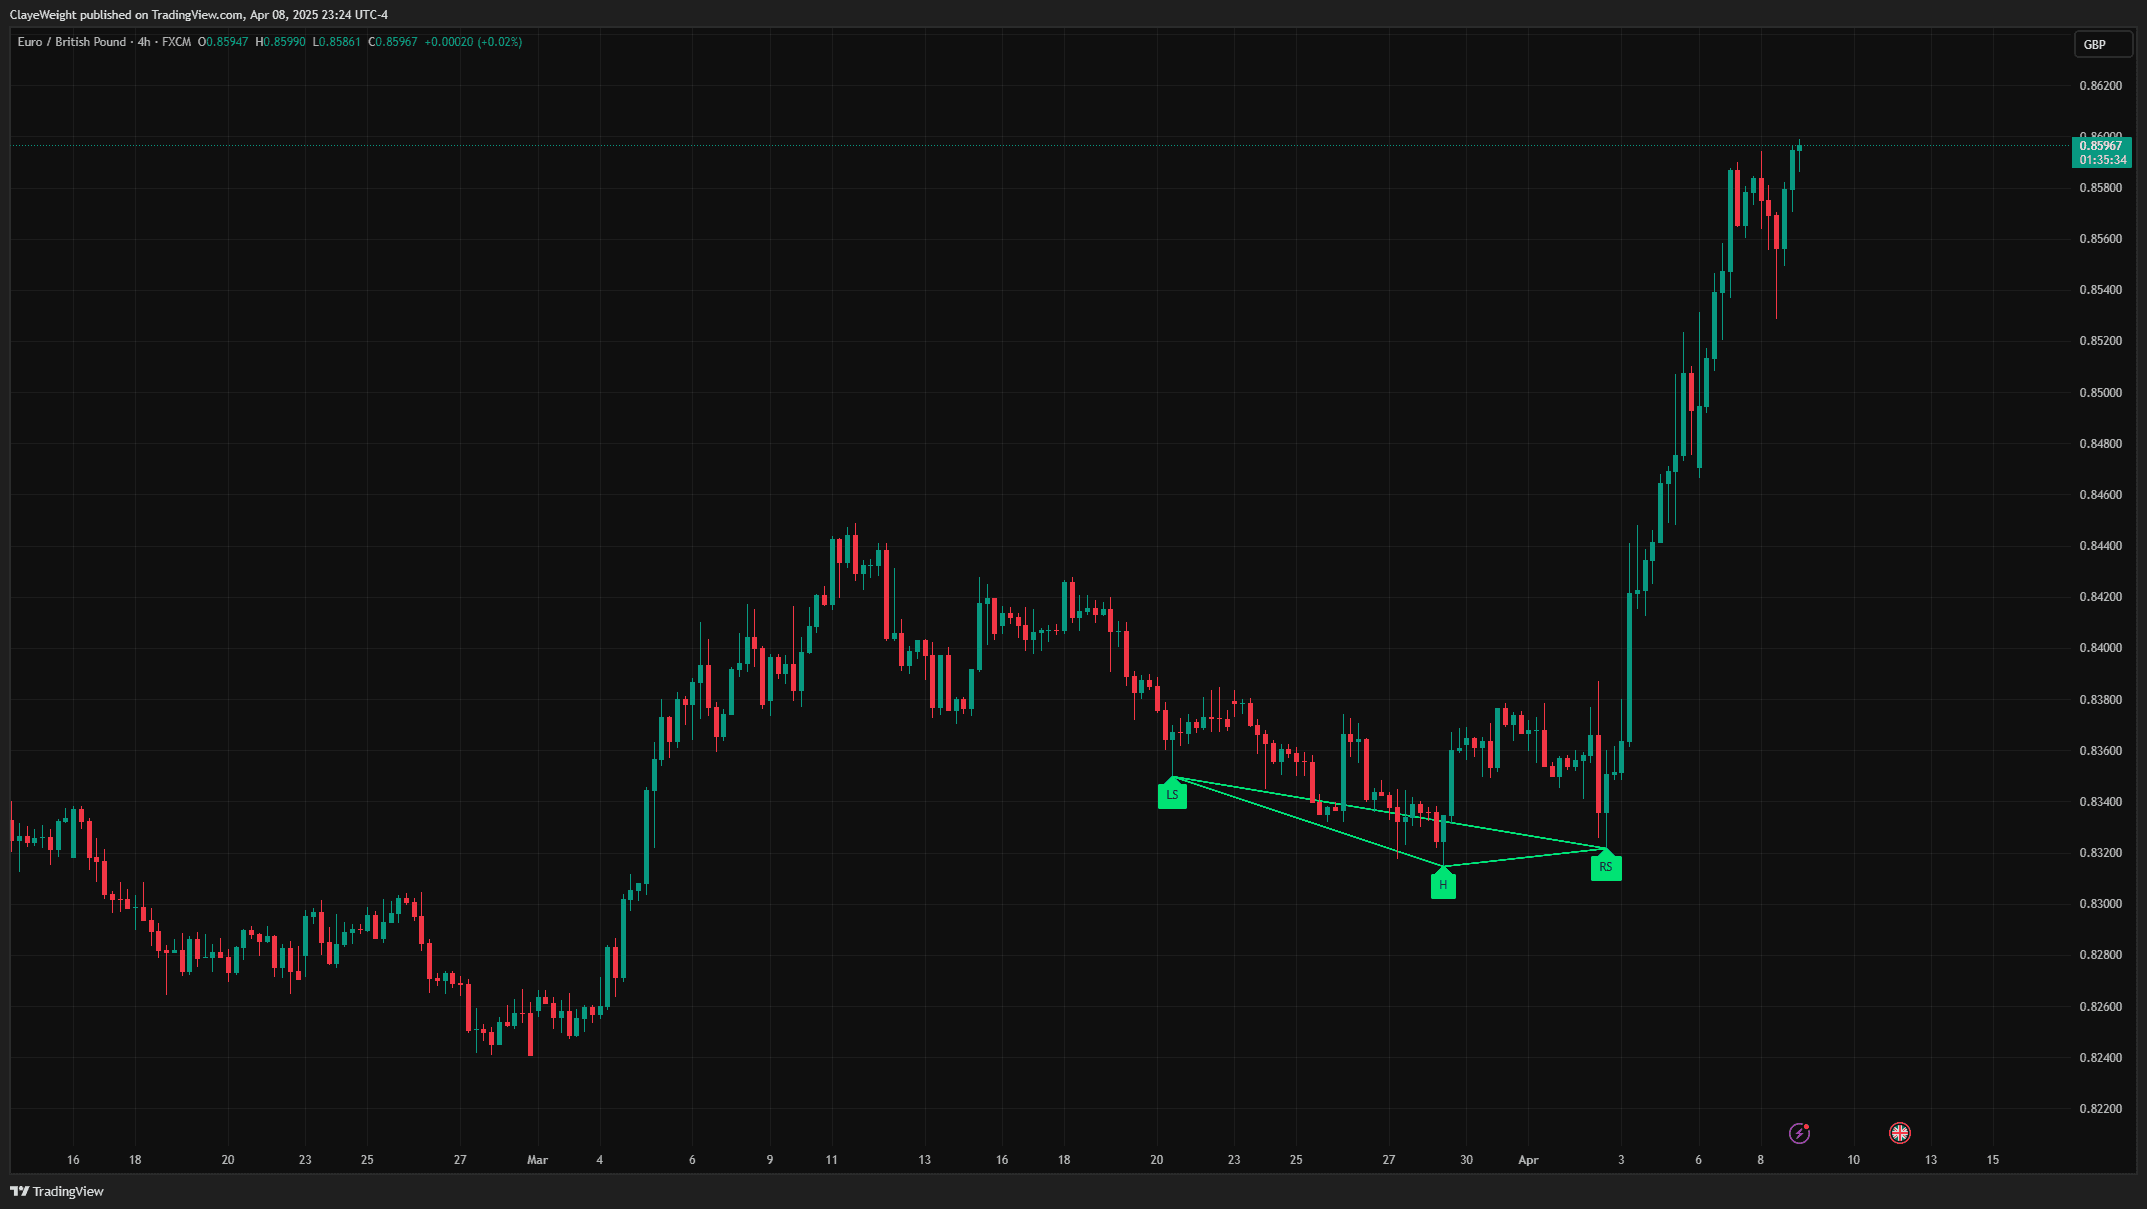
What's Included
How Head & Shoulders Pattern works
The head and shoulders is one of the oldest and most widely recognised reversal patterns in technical analysis. It forms as three peaks: a first peak (the left shoulder), a higher peak (the head), and a third, lower peak roughly level with the first (the right shoulder). A line connecting the two intervening troughs is the neckline, and a break of that neckline signals the potential reversal from up to down. The inverse pattern mirrors this at market bottoms with three troughs.
The logic is a loss of momentum. Each successive push fails to sustain new highs after the head, and the lower right shoulder shows buyers are no longer able to press price higher. Volume traditionally tapers through the formation and expands on the neckline break, adding conviction. The measured-move target is estimated by taking the vertical distance from the head to the neckline and projecting it from the break point in the direction of the breakout.
In practice, traders wait for a decisive neckline break rather than anticipating one, and many look for a retest of the broken neckline as former support turned resistance before committing. The measured move is a guideline for a target, not a promise, and the pattern can fail if price reclaims the neckline.
When to use it
- Spotting potential trend reversals after an extended move up (head and shoulders) or down (inverse).
- Setting a measured-move target using the head-to-neckline distance projected from the break.
- Timing entries on a confirmed neckline break, or on a retest of the broken neckline.
- Placing logical invalidation above the right shoulder (or below it for the inverse pattern).
When it's not the right tool
- Choppy or range-bound markets that throw up messy, unreliable shapes resembling the pattern.
- Acting before the neckline breaks; an unconfirmed pattern often fails to complete.
- Treating the measured move as a certainty rather than a rough, frequently-missed target.
Source Code Preview
Get the full PineScript v6 source code—use it as a foundation and build on top of it with HorizonAI.
Frequently asked questions
How do I calculate the price target?
Measure the vertical distance from the top of the head to the neckline, then project that same distance from the point where price breaks the neckline, in the direction of the break. It gives a reasonable objective, but price can fall short of or exceed it, so treat it as a guide rather than a fixed destination.
Should I enter as soon as I spot the pattern?
Generally no. The pattern is only confirmed when price closes decisively through the neckline. Many traders wait for that break, and some for a subsequent retest of the neckline as new resistance or support, to reduce the chance of trading a formation that never completes.
What is an inverse head and shoulders?
It is the same structure flipped for market bottoms: three troughs with a lower middle trough (the head) and a neckline above. A break above the neckline signals a potential reversal from down to up. The measured-move logic and the risk of false breaks apply equally, so confirmation still matters.
Related Scripts
 Pro
ProMarket Structure
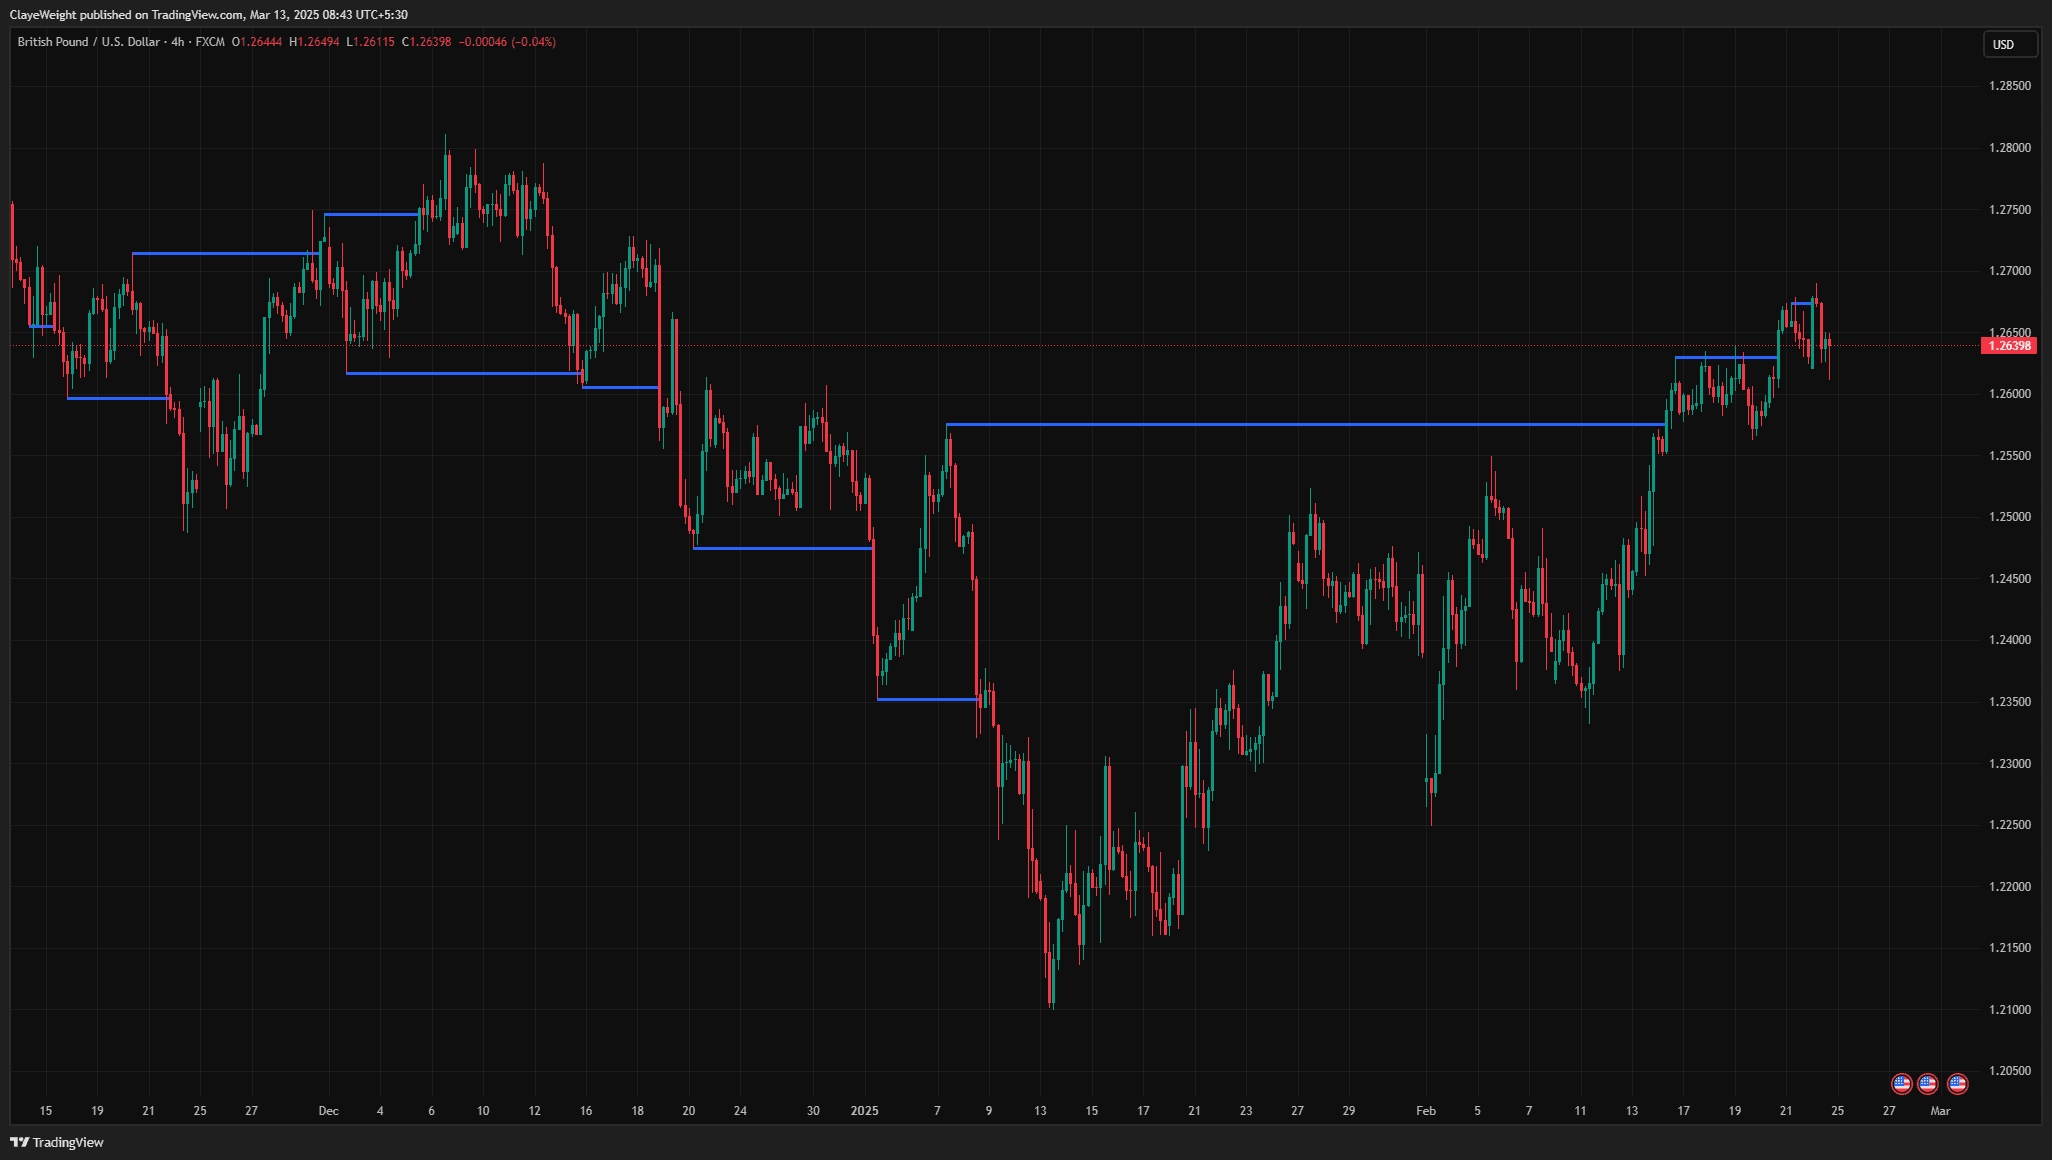
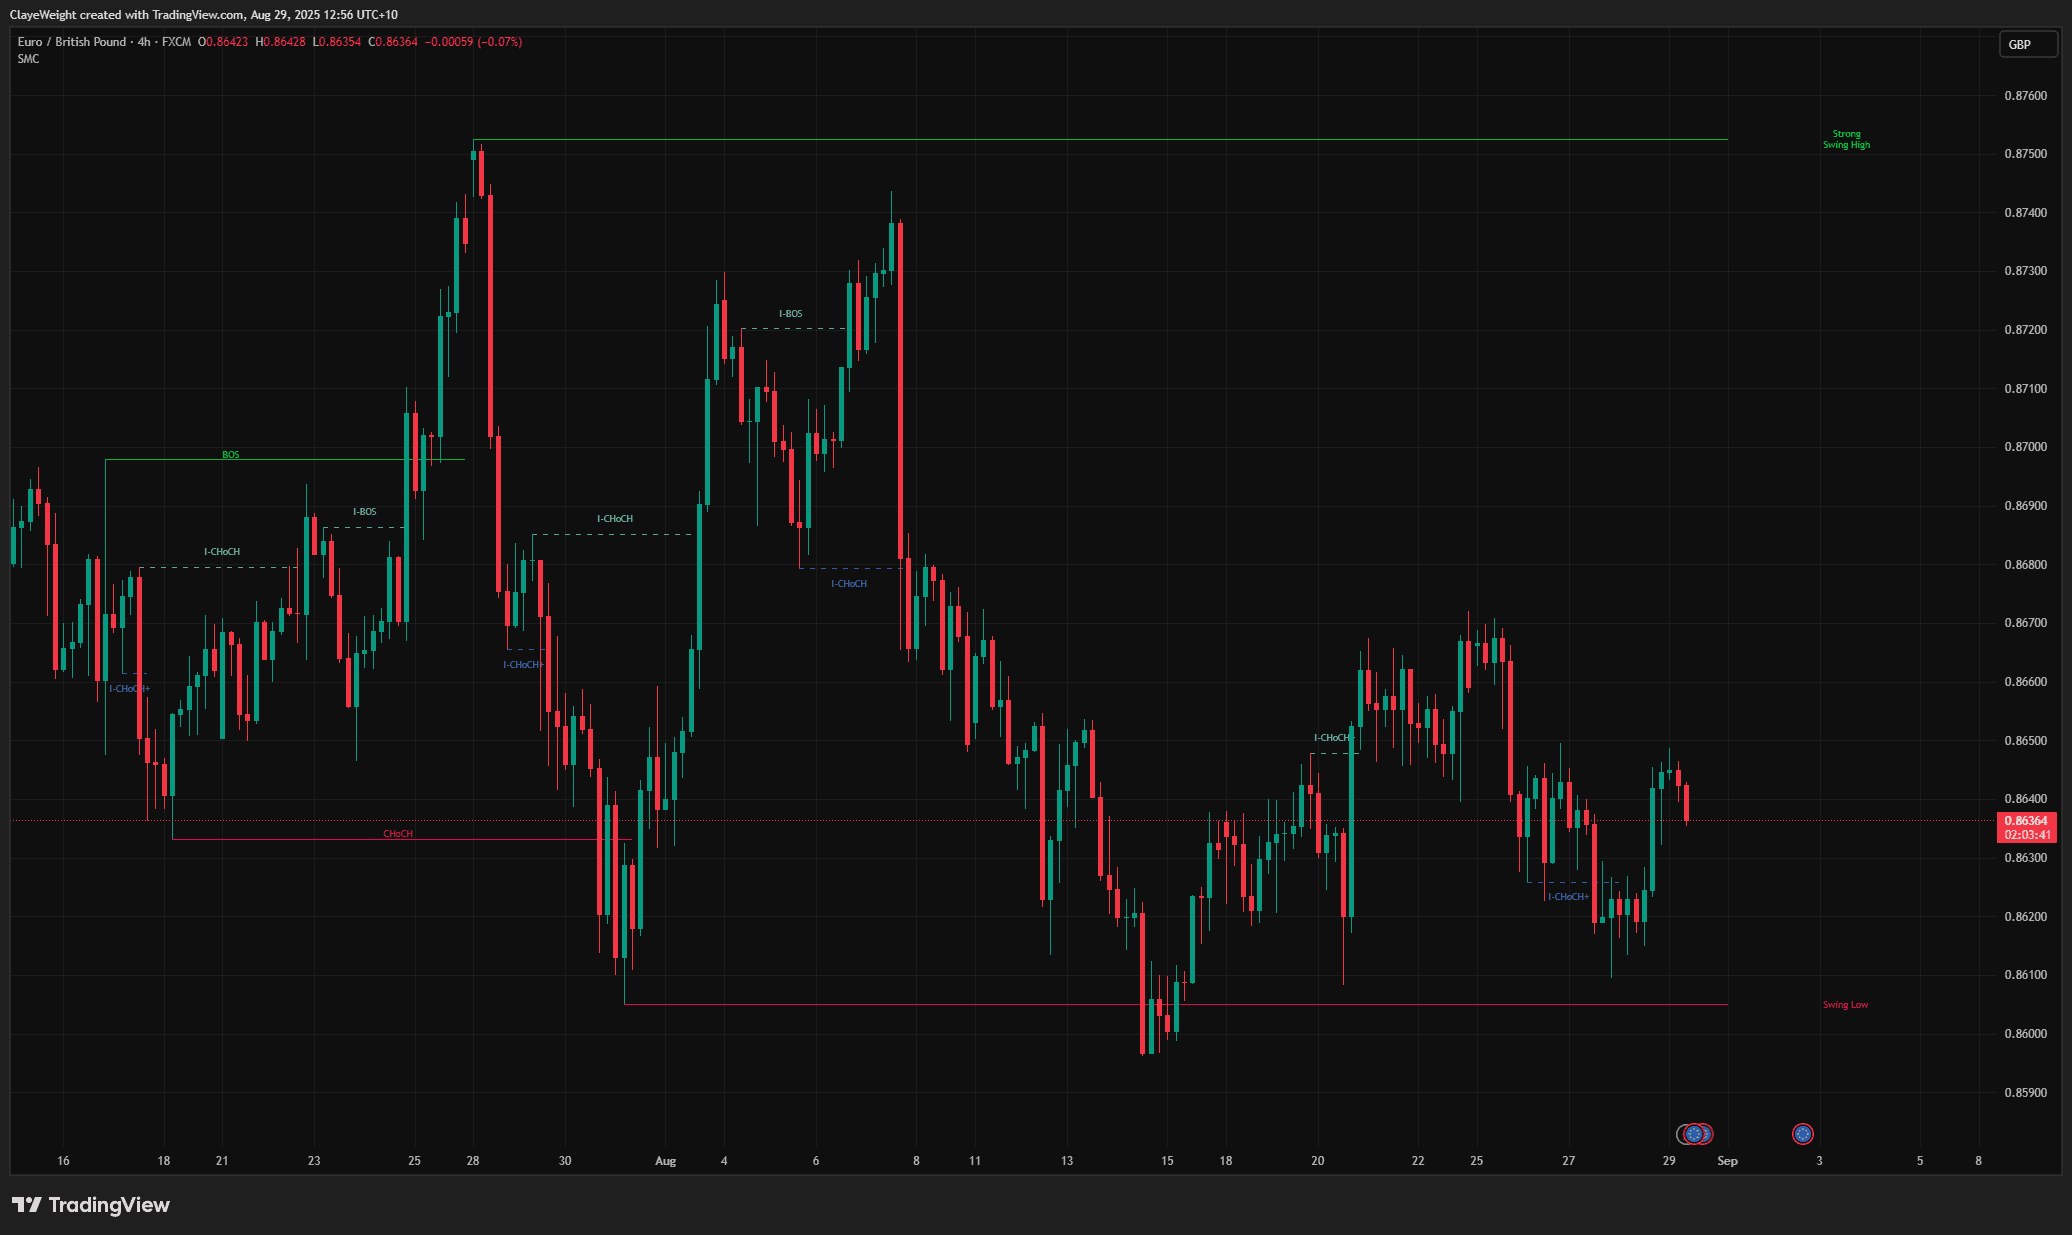
Automatically maps swing highs and lows with break of structure detection.
 Pro
ProSMC Market Structure Pro
Advanced Smart Money Concepts with internal and swing structure mapping.
 Free
FreeLiquidity Levels
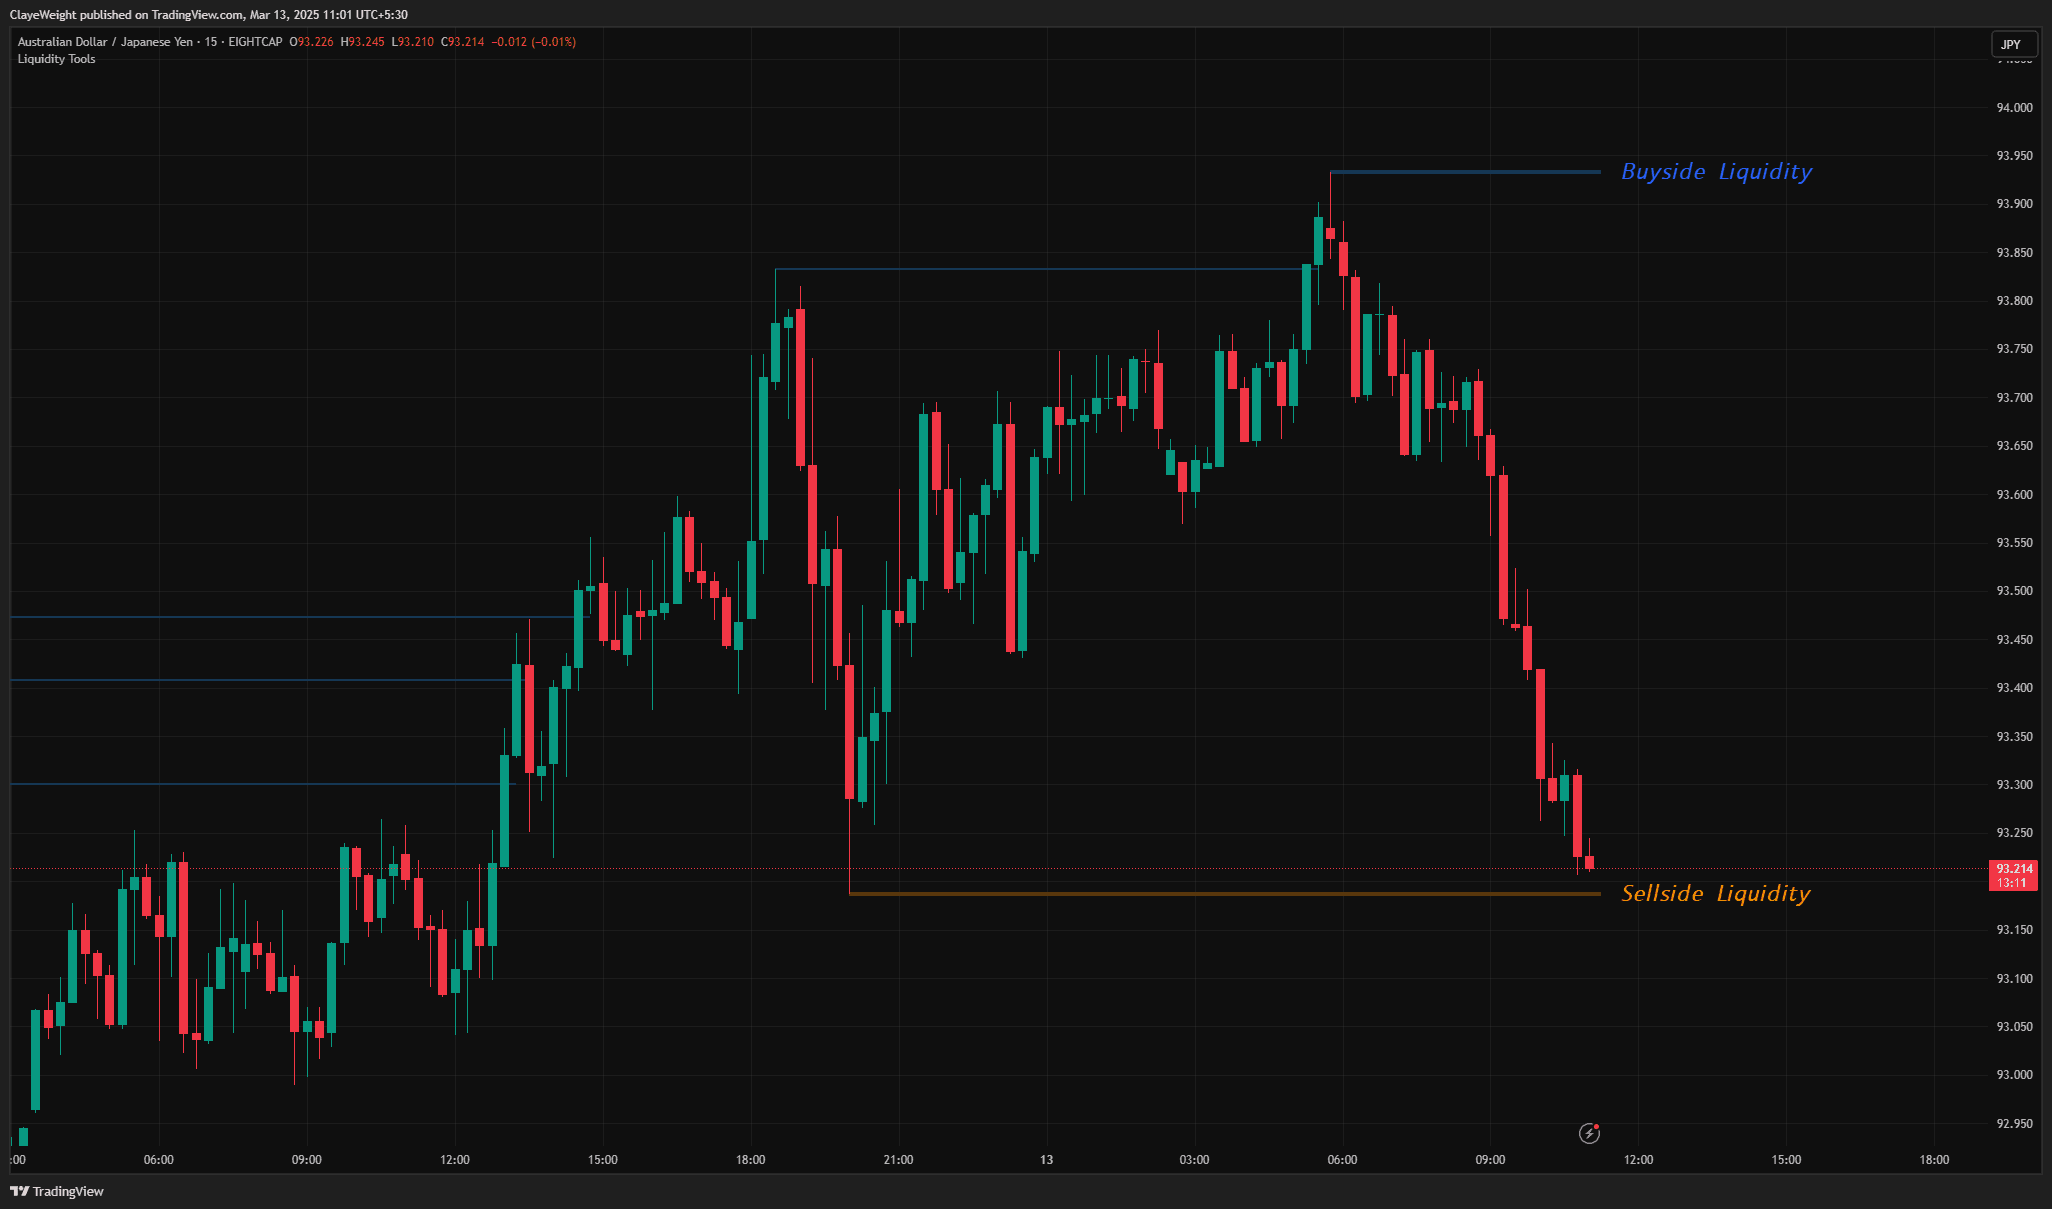
A comprehensive suite designed to identify and track institutional liquidity zones, stop hunts, and more.
Get access to all 23+ scripts
Full source code, alert templates, and the perfect base to build on with HorizonAI. Join 10,000+ traders.