
Reversion Bands
Statistical bands that adapt to volatility and identify extreme price extensions. When price reaches the outer bands, mean reversion is likely. Combines standard deviation with ATR for more accurate extreme detection.
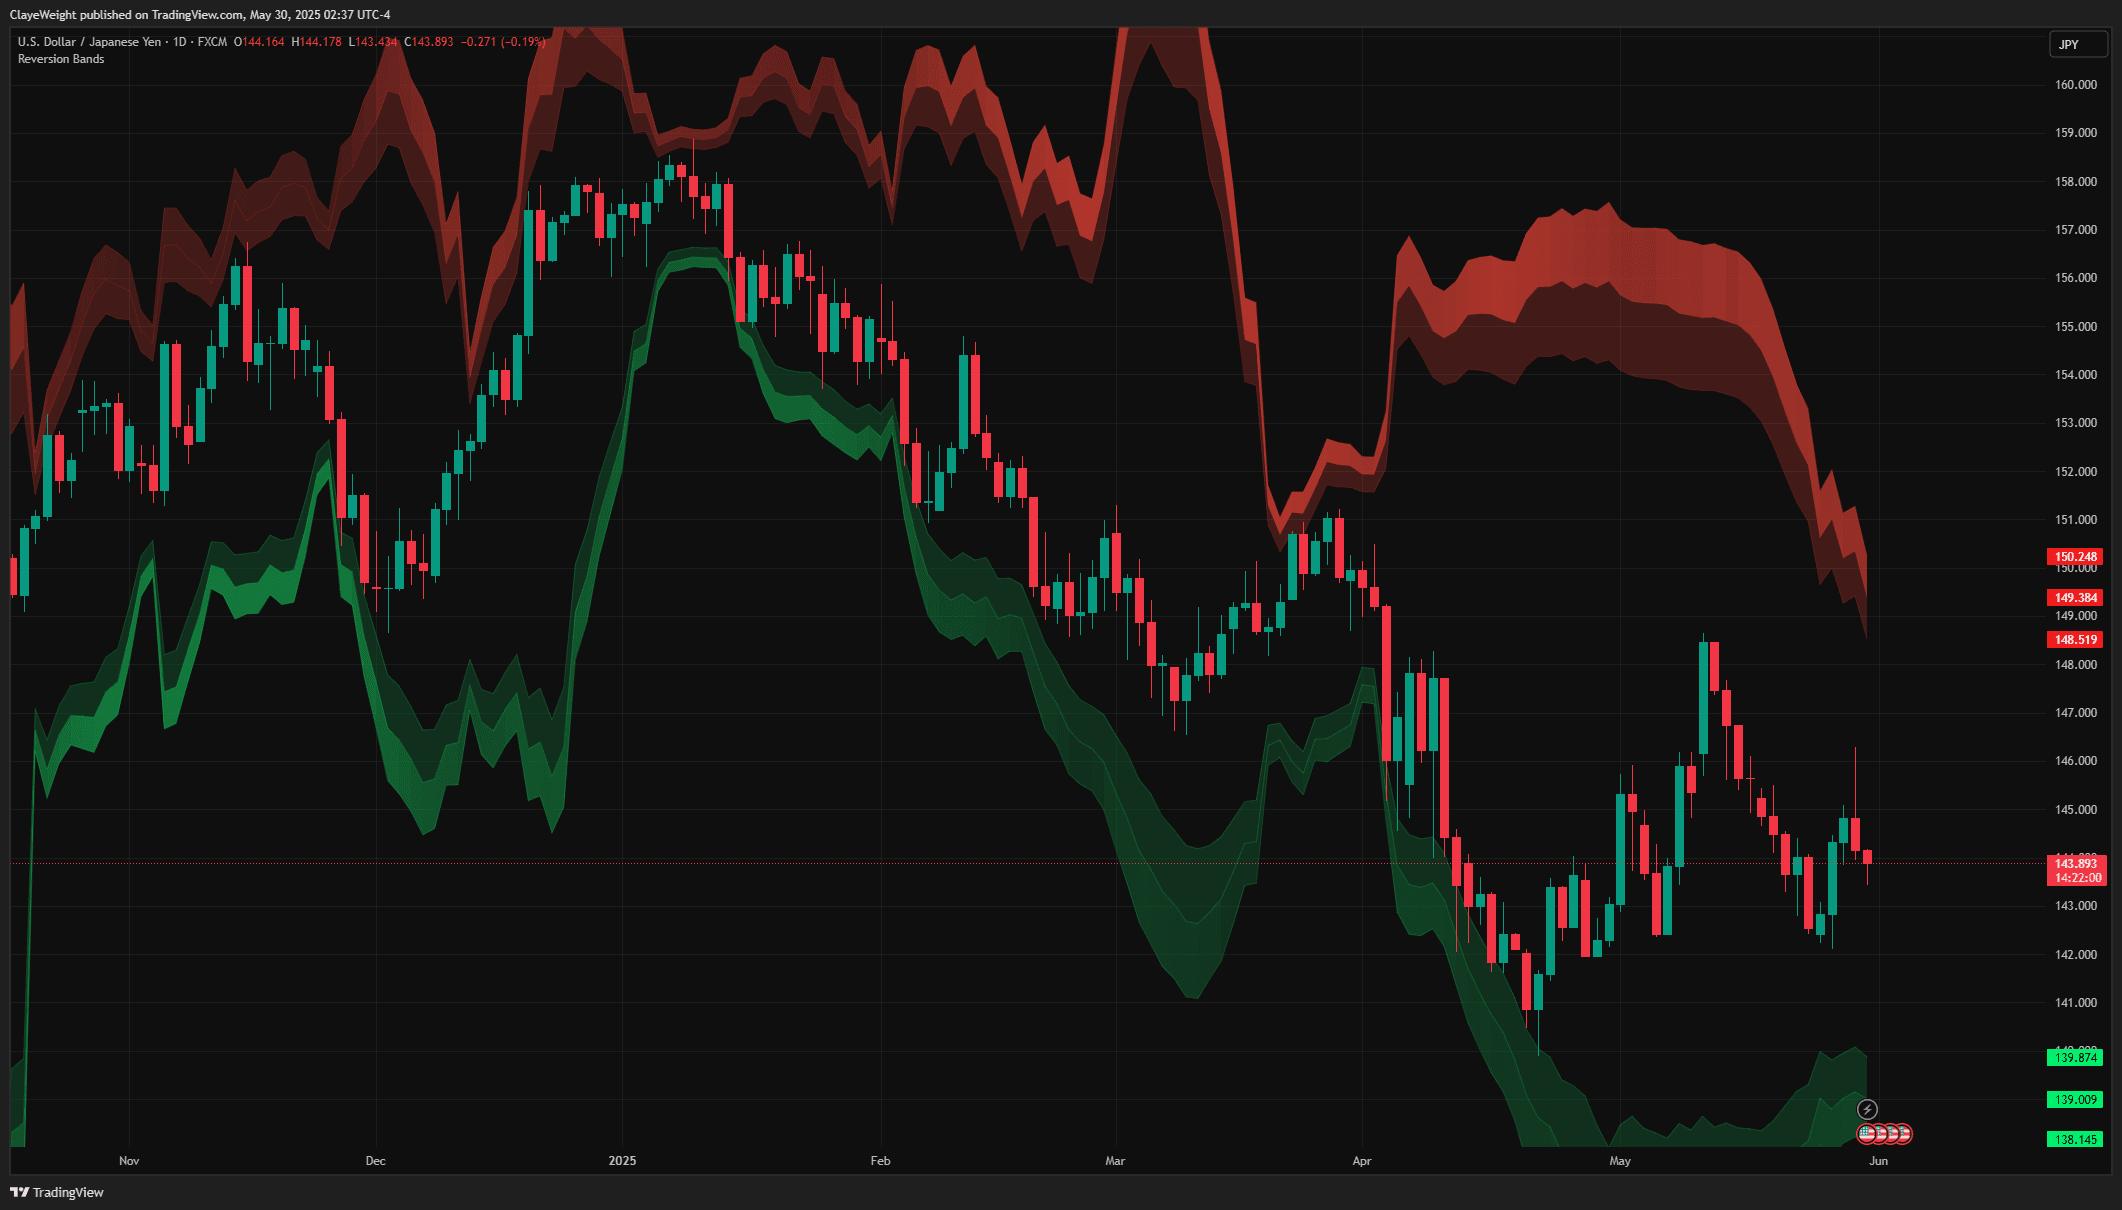
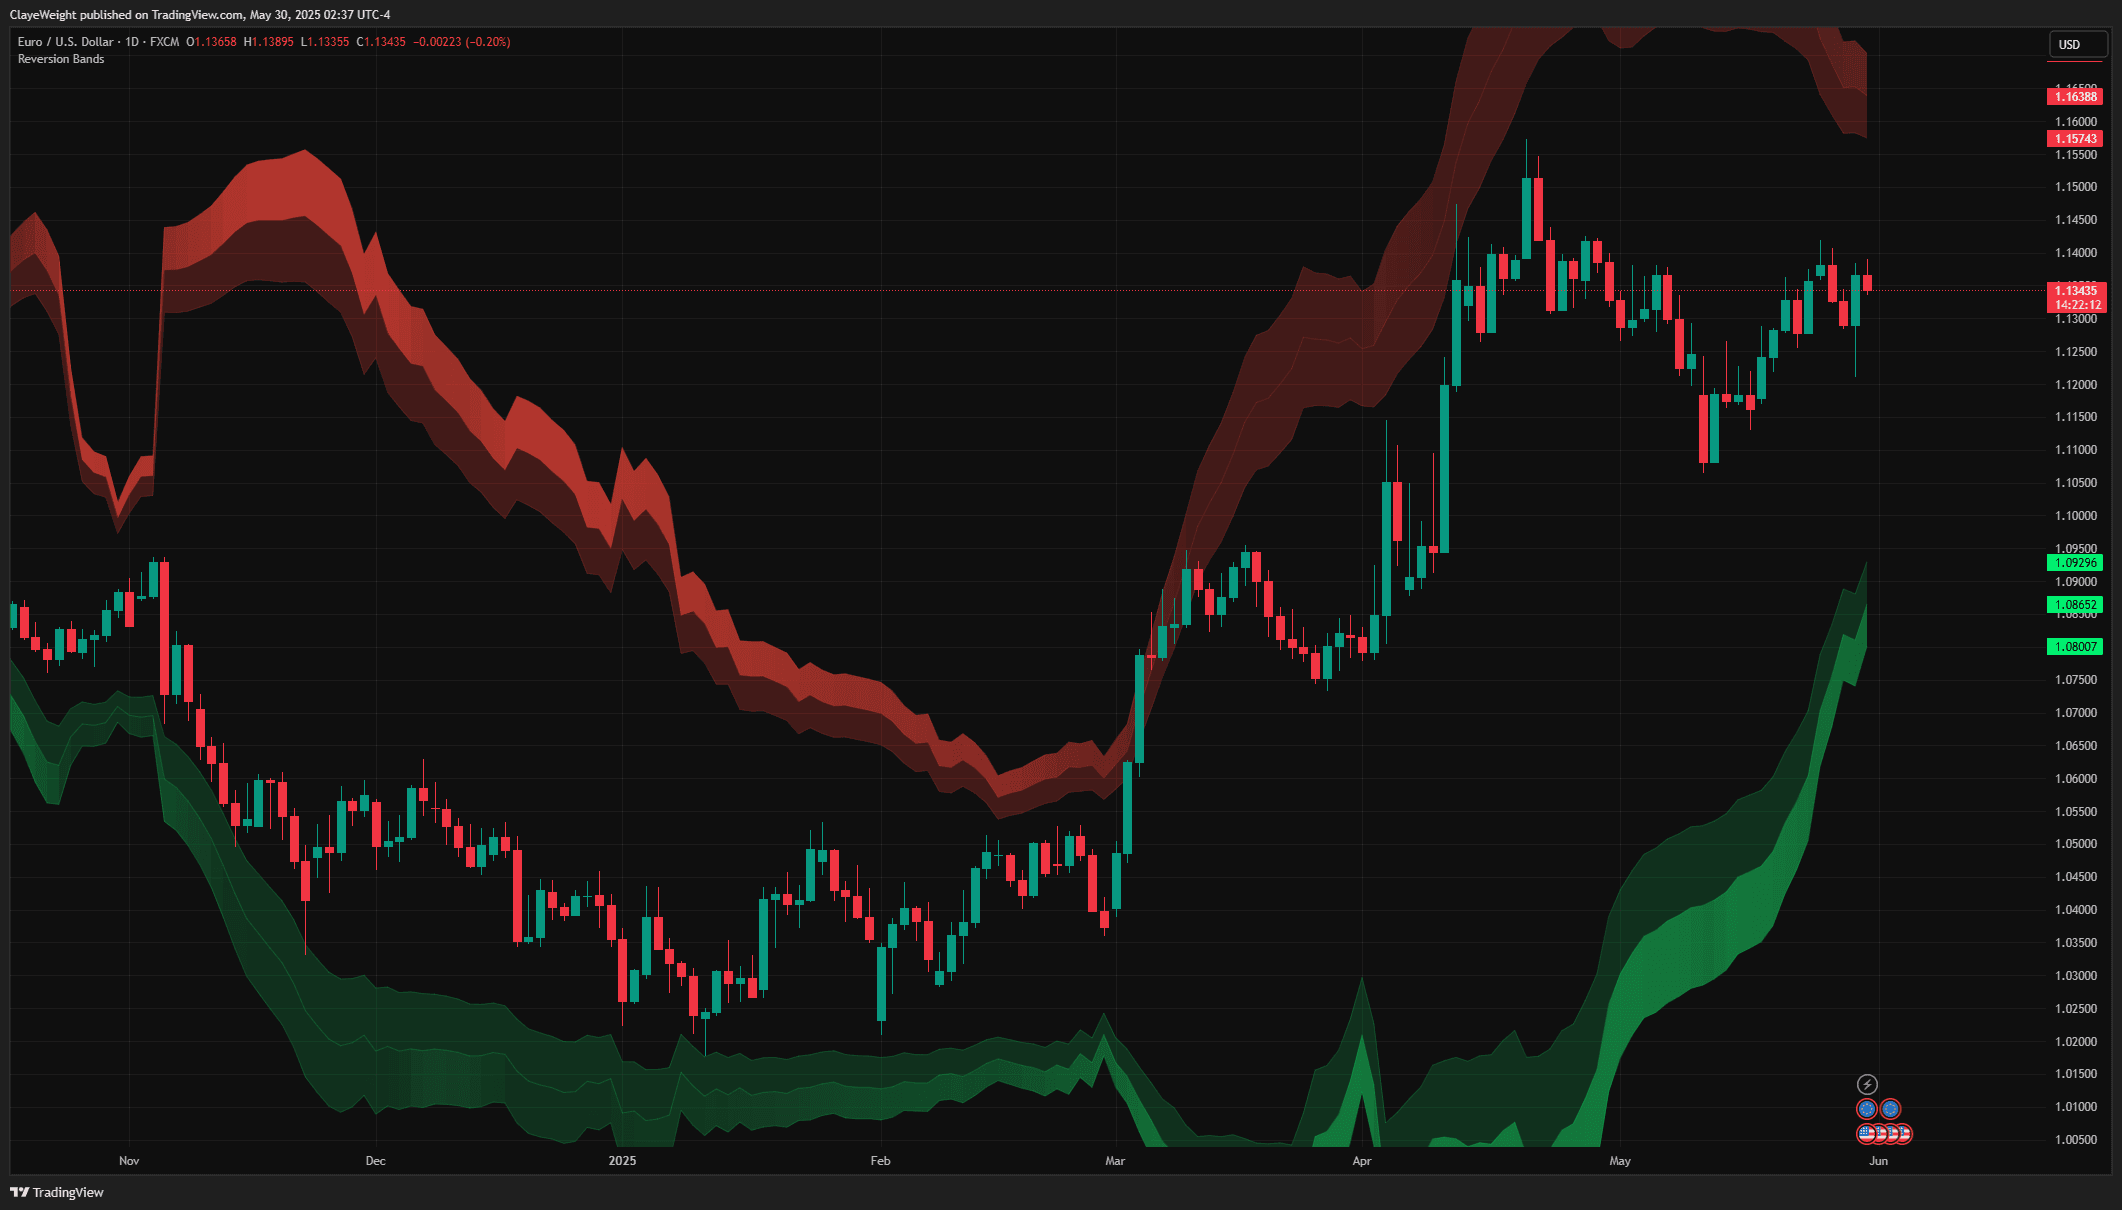
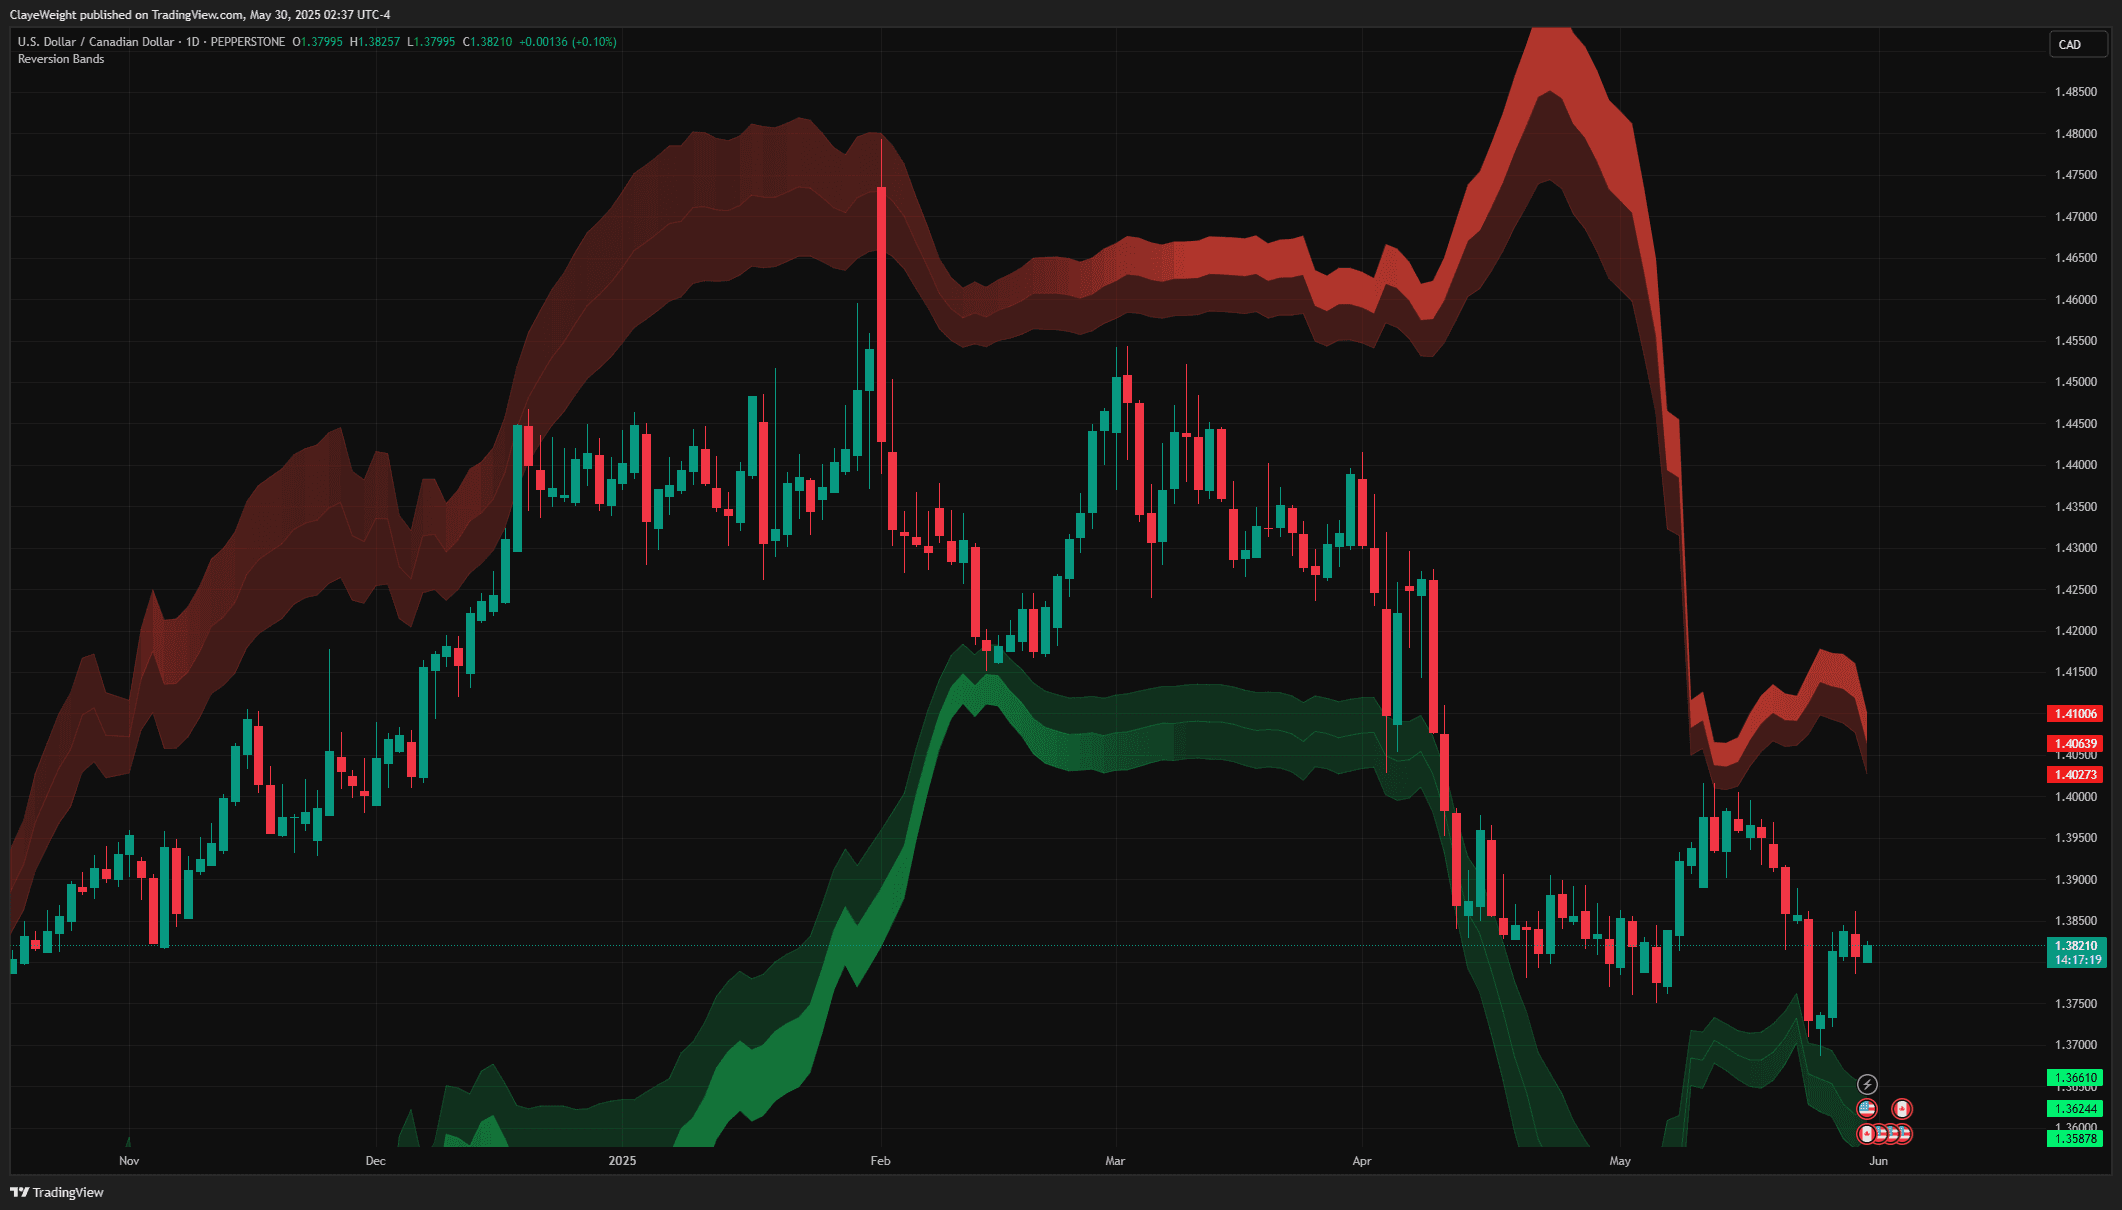
What's Included
How Reversion Bands works
Reversion bands are envelopes drawn around a central average that expand and contract with volatility. They combine a statistical measure of dispersion, such as standard deviation, with a range-based measure like ATR so the bands widen in fast markets and tighten in quiet ones. This adaptiveness keeps the outer edges meaningful instead of being constantly hit or never reached.
The core idea is mean reversion: over the short term, price tends to oscillate around its average, and moves that stretch to the outer bands are statistically extended. When price reaches an outer extreme it is considered stretched relative to recent behavior and prone to snap back toward the mean. The band touch flags the stretch; it does not force a turn.
Traders use the mean itself as a moving reference for equilibrium and the bands as zones of exhaustion. Rather than chasing price at the edges, the approach looks for signs that momentum is fading at an outer band and then plays the reversion back toward the center, managing risk in case the stretch simply continues.
When to use it
- Fading overextended moves in ranging or mean-reverting conditions when price tags an outer band
- Using the central average as a logical take-profit target for a reversion trade
- Gauging whether price is statistically stretched or still within its normal envelope
- Timing entries in sideways markets where price repeatedly rotates between the bands
When it's not the right tool
- In strong trends, where price can ride an outer band for a long time and reversion entries get run over
- As a standalone reversal trigger; a band touch shows a stretch, not confirmation that price will turn
- During volatility regime shifts, when the bands are still catching up and outer touches lose their edge
Source Code Preview
Get the full PineScript v6 source code—use it as a foundation and build on top of it with HorizonAI.
Frequently asked questions
What are reversion bands?
They are volatility-adaptive bands around a central average that mark how far price has stretched from its mean. Because they blend a statistical dispersion measure with a volatility measure, they widen and narrow with market conditions. A touch of the outer band flags that price is statistically extended relative to recent action.
Does price always reverse at the outer band?
No. Touching a band signals a stretch, not a guaranteed reversal, and in strong trends price can hug an outer band while the market keeps running. That is why the bands work best in ranging conditions and should be paired with confirmation and a stop in case the move continues.
How is this different from standard Bollinger Bands?
Standard bands typically rely on standard deviation alone. Reversion bands additionally incorporate a range-based volatility measure such as ATR, which can make the envelope respond more smoothly to changing volatility. The trading logic, fading extremes back to the mean, is similar in spirit.
Can I combine reversion bands with trend tools?
Yes, and it is often wise to. A trend filter helps you avoid fading a strong trend, so you only take reversion trades when a higher-timeframe read is neutral or aligned. With HorizonAI you can adjust how the bands weight volatility to suit the instrument you trade.
Related Scripts
 Pro
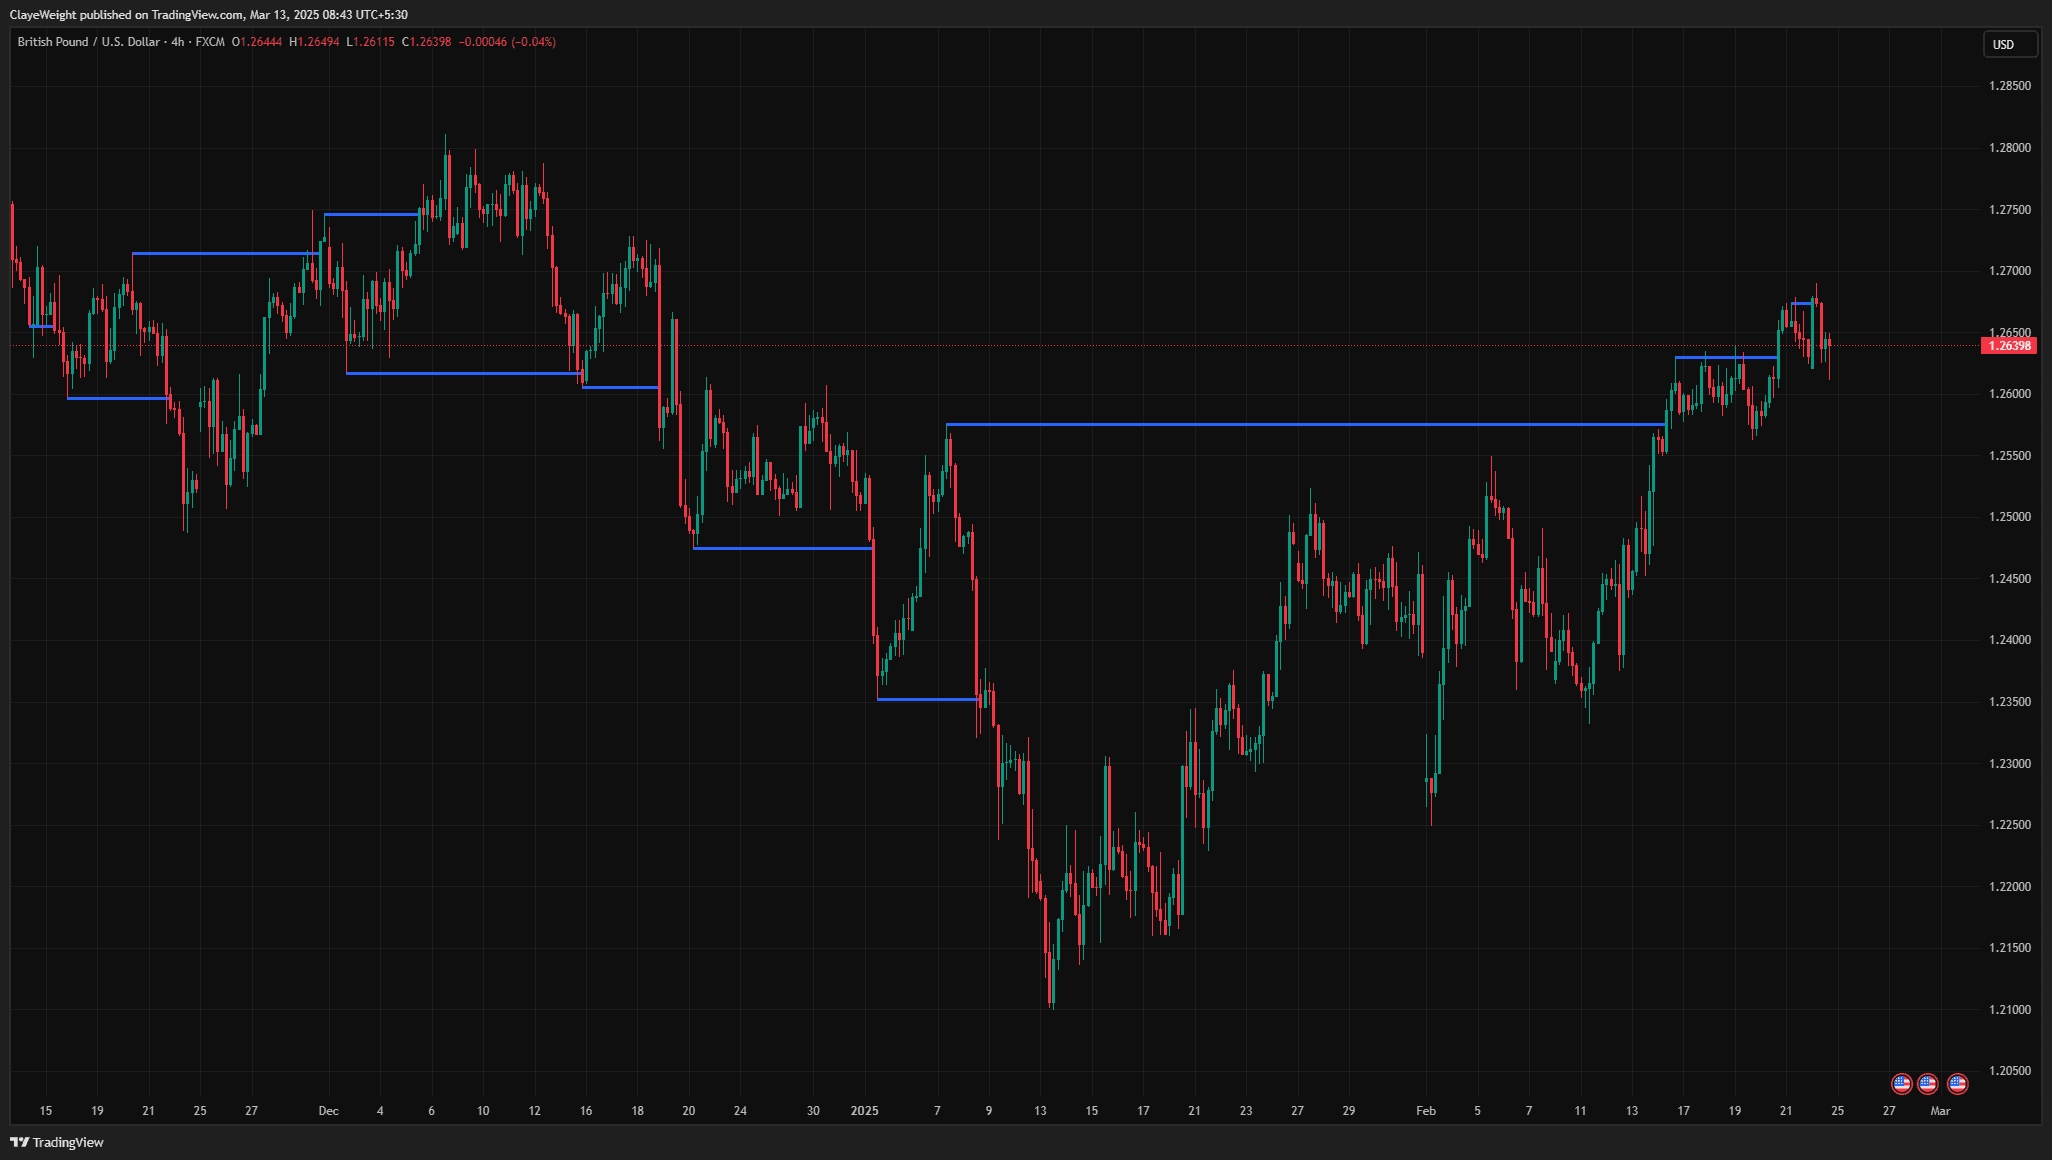
ProMarket Structure
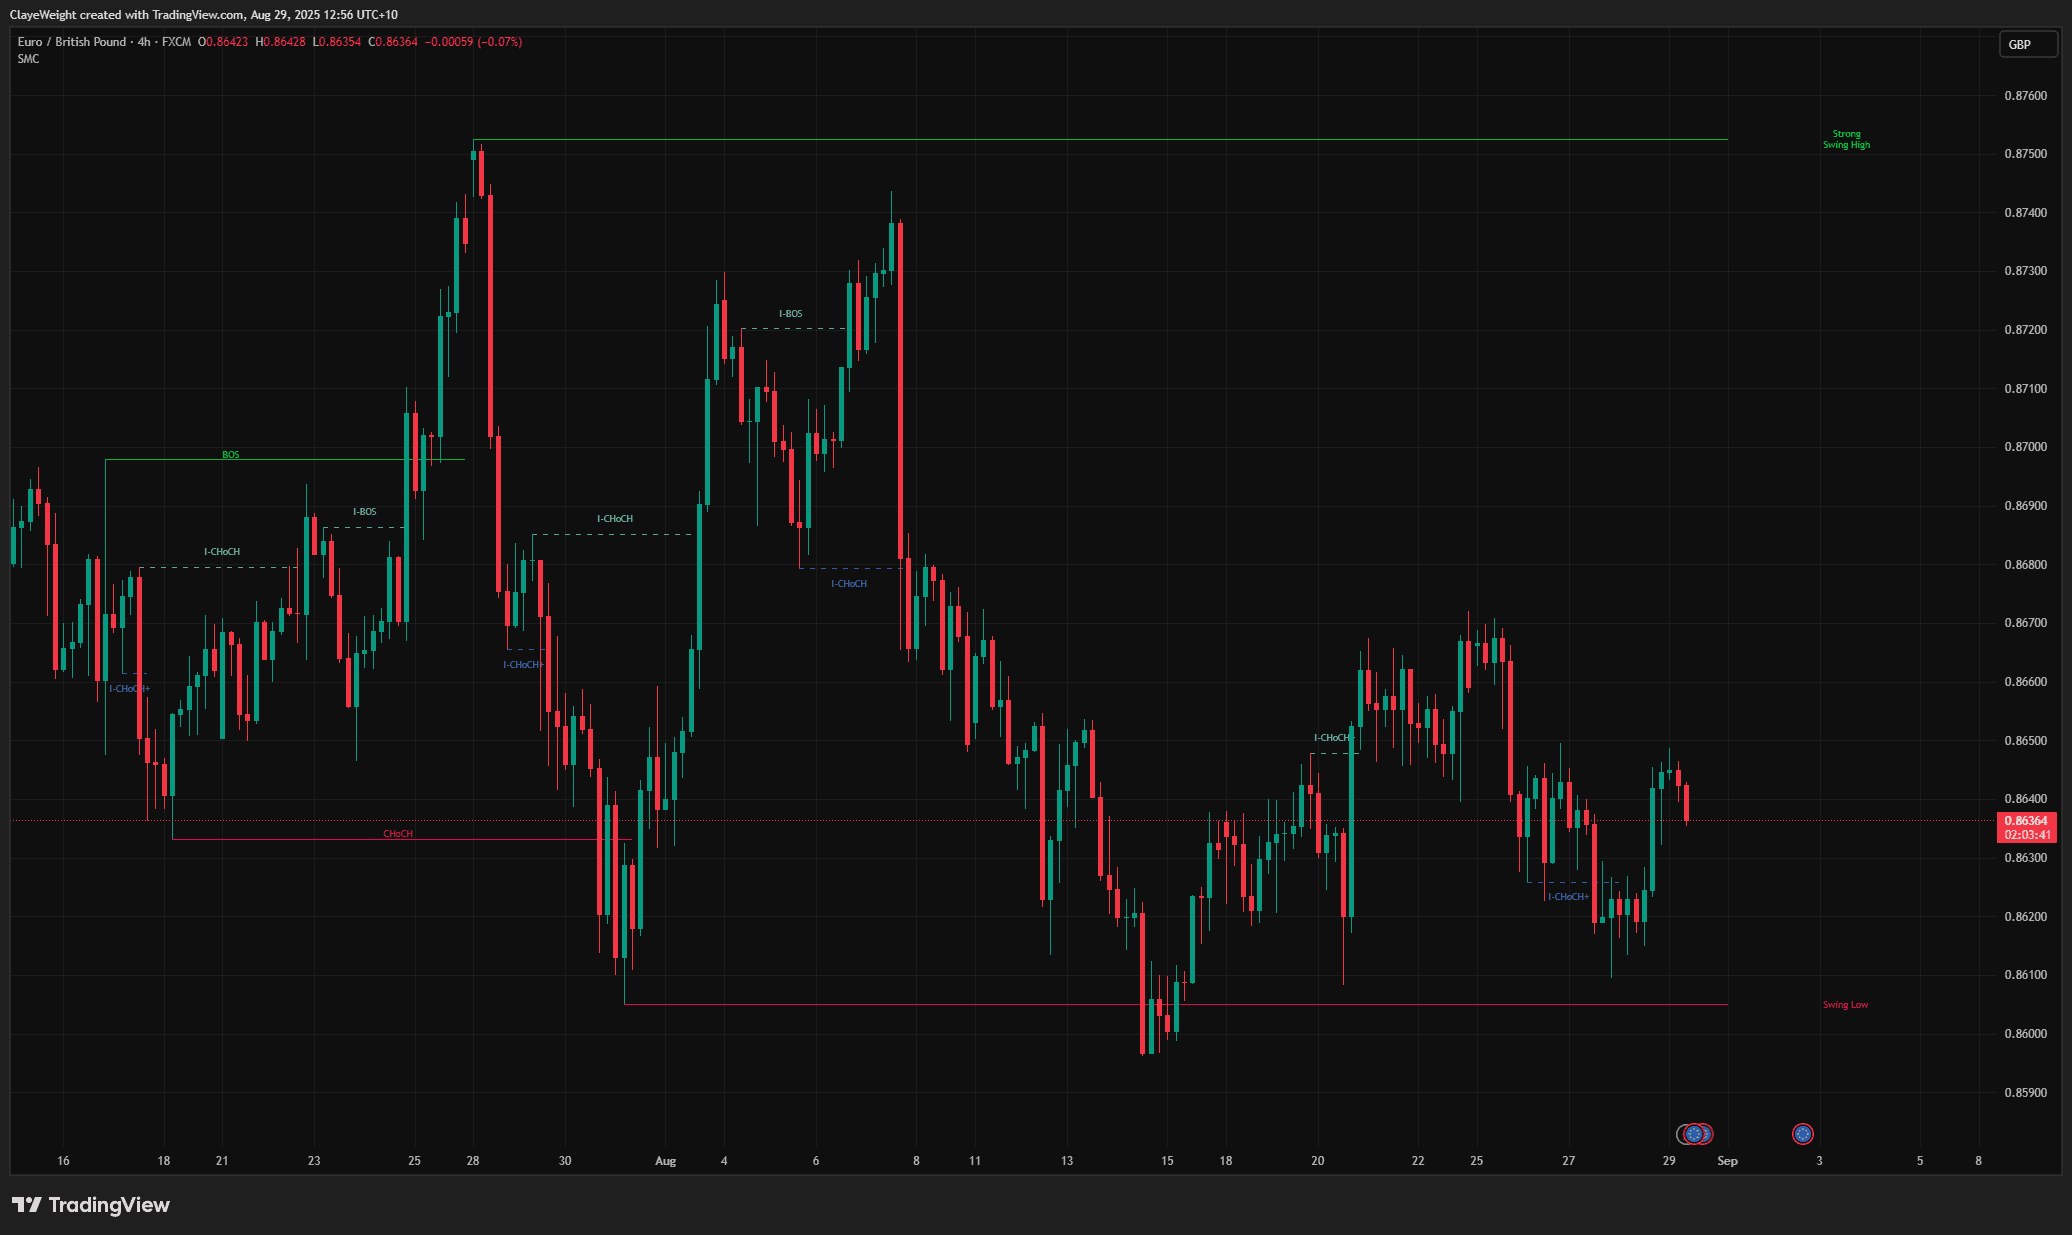
Automatically maps swing highs and lows with break of structure detection.
 Pro
ProSMC Market Structure Pro
Advanced Smart Money Concepts with internal and swing structure mapping.
 Free
FreeLiquidity Levels
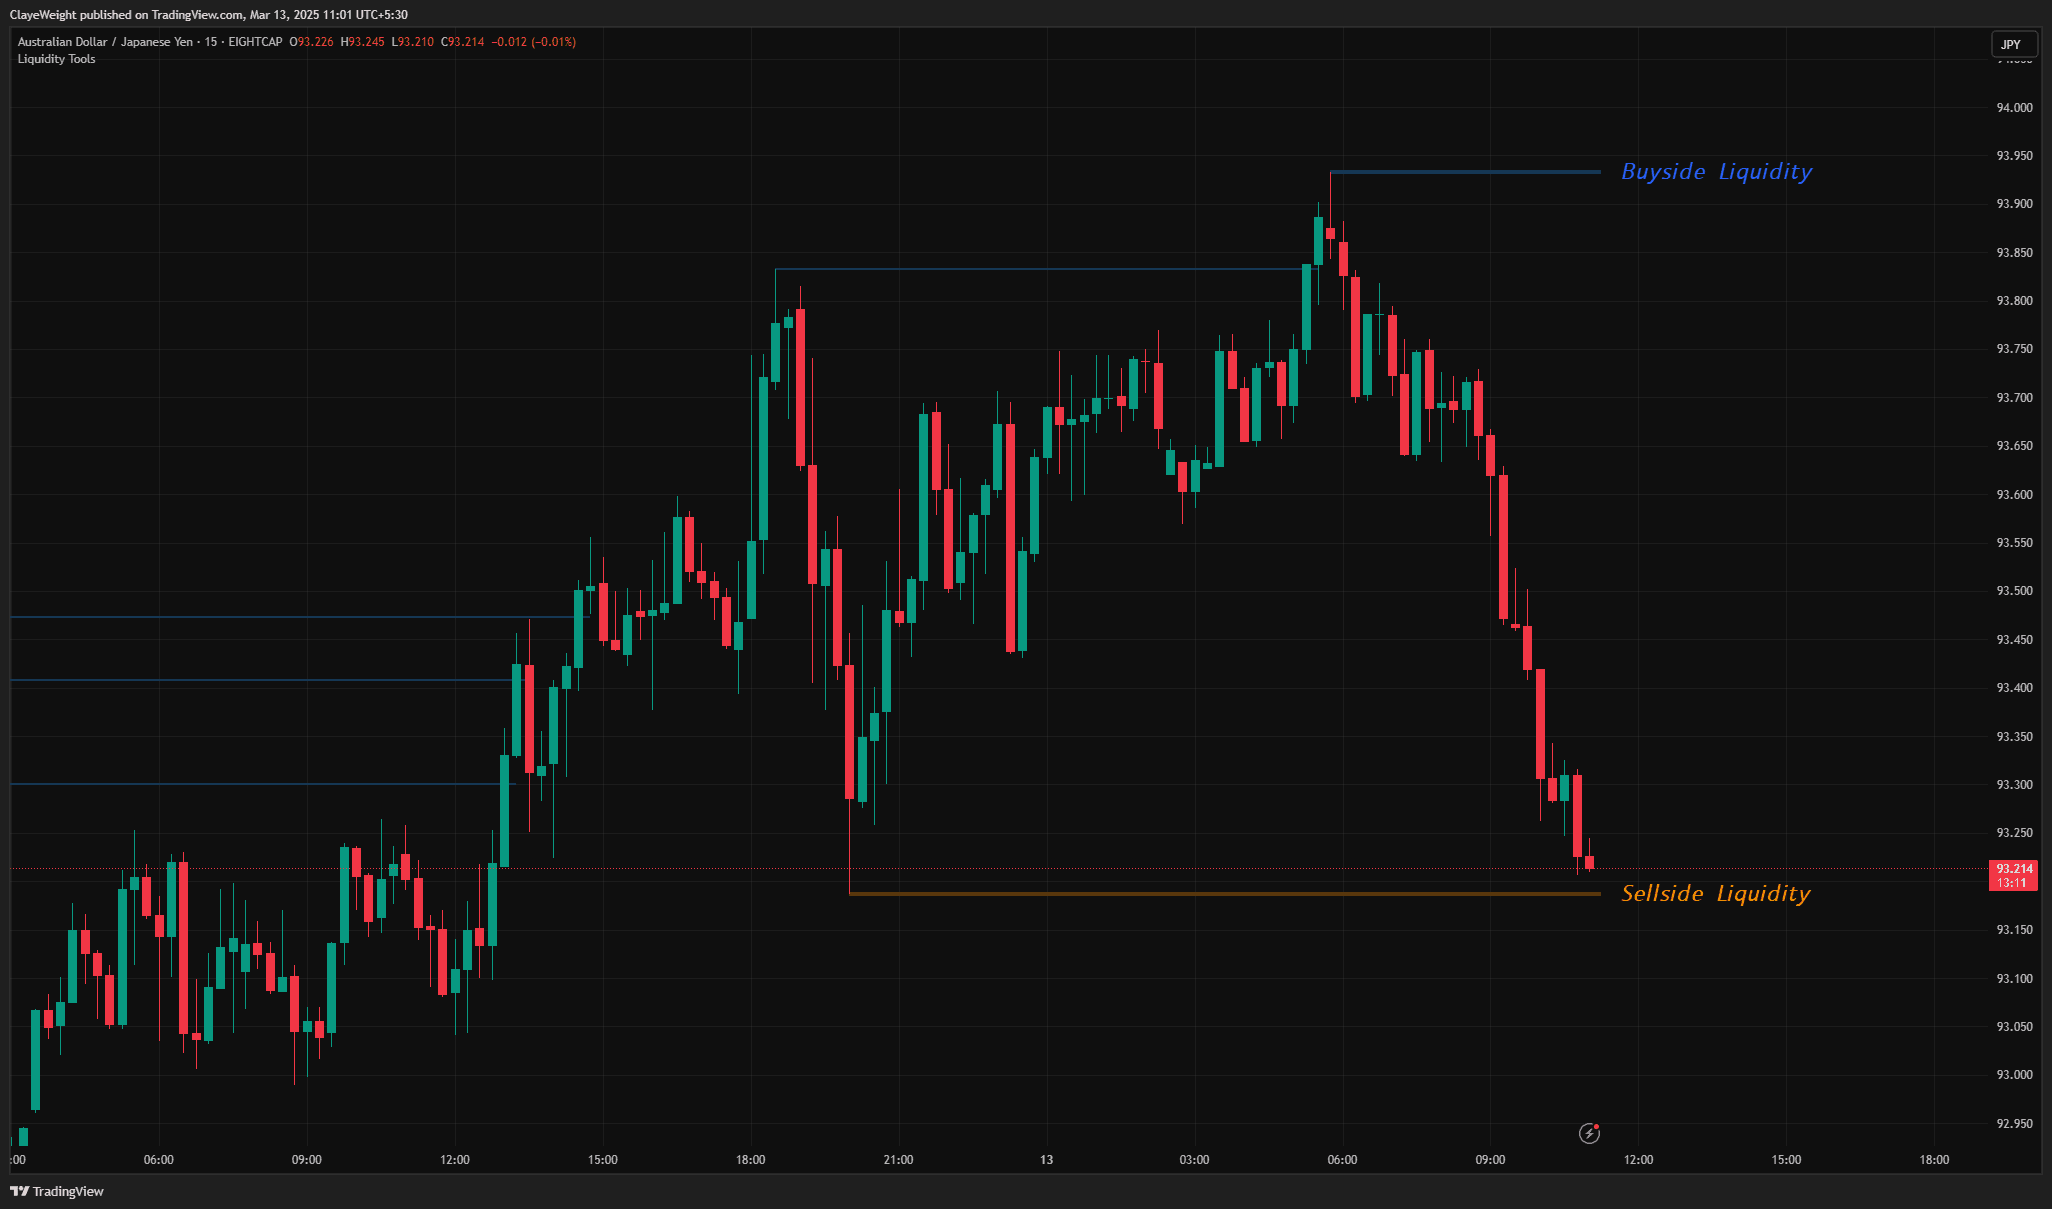
A comprehensive suite designed to identify and track institutional liquidity zones, stop hunts, and more.
Get access to all 23+ scripts
Full source code, alert templates, and the perfect base to build on with HorizonAI. Join 10,000+ traders.