
Support & Resistance Strength
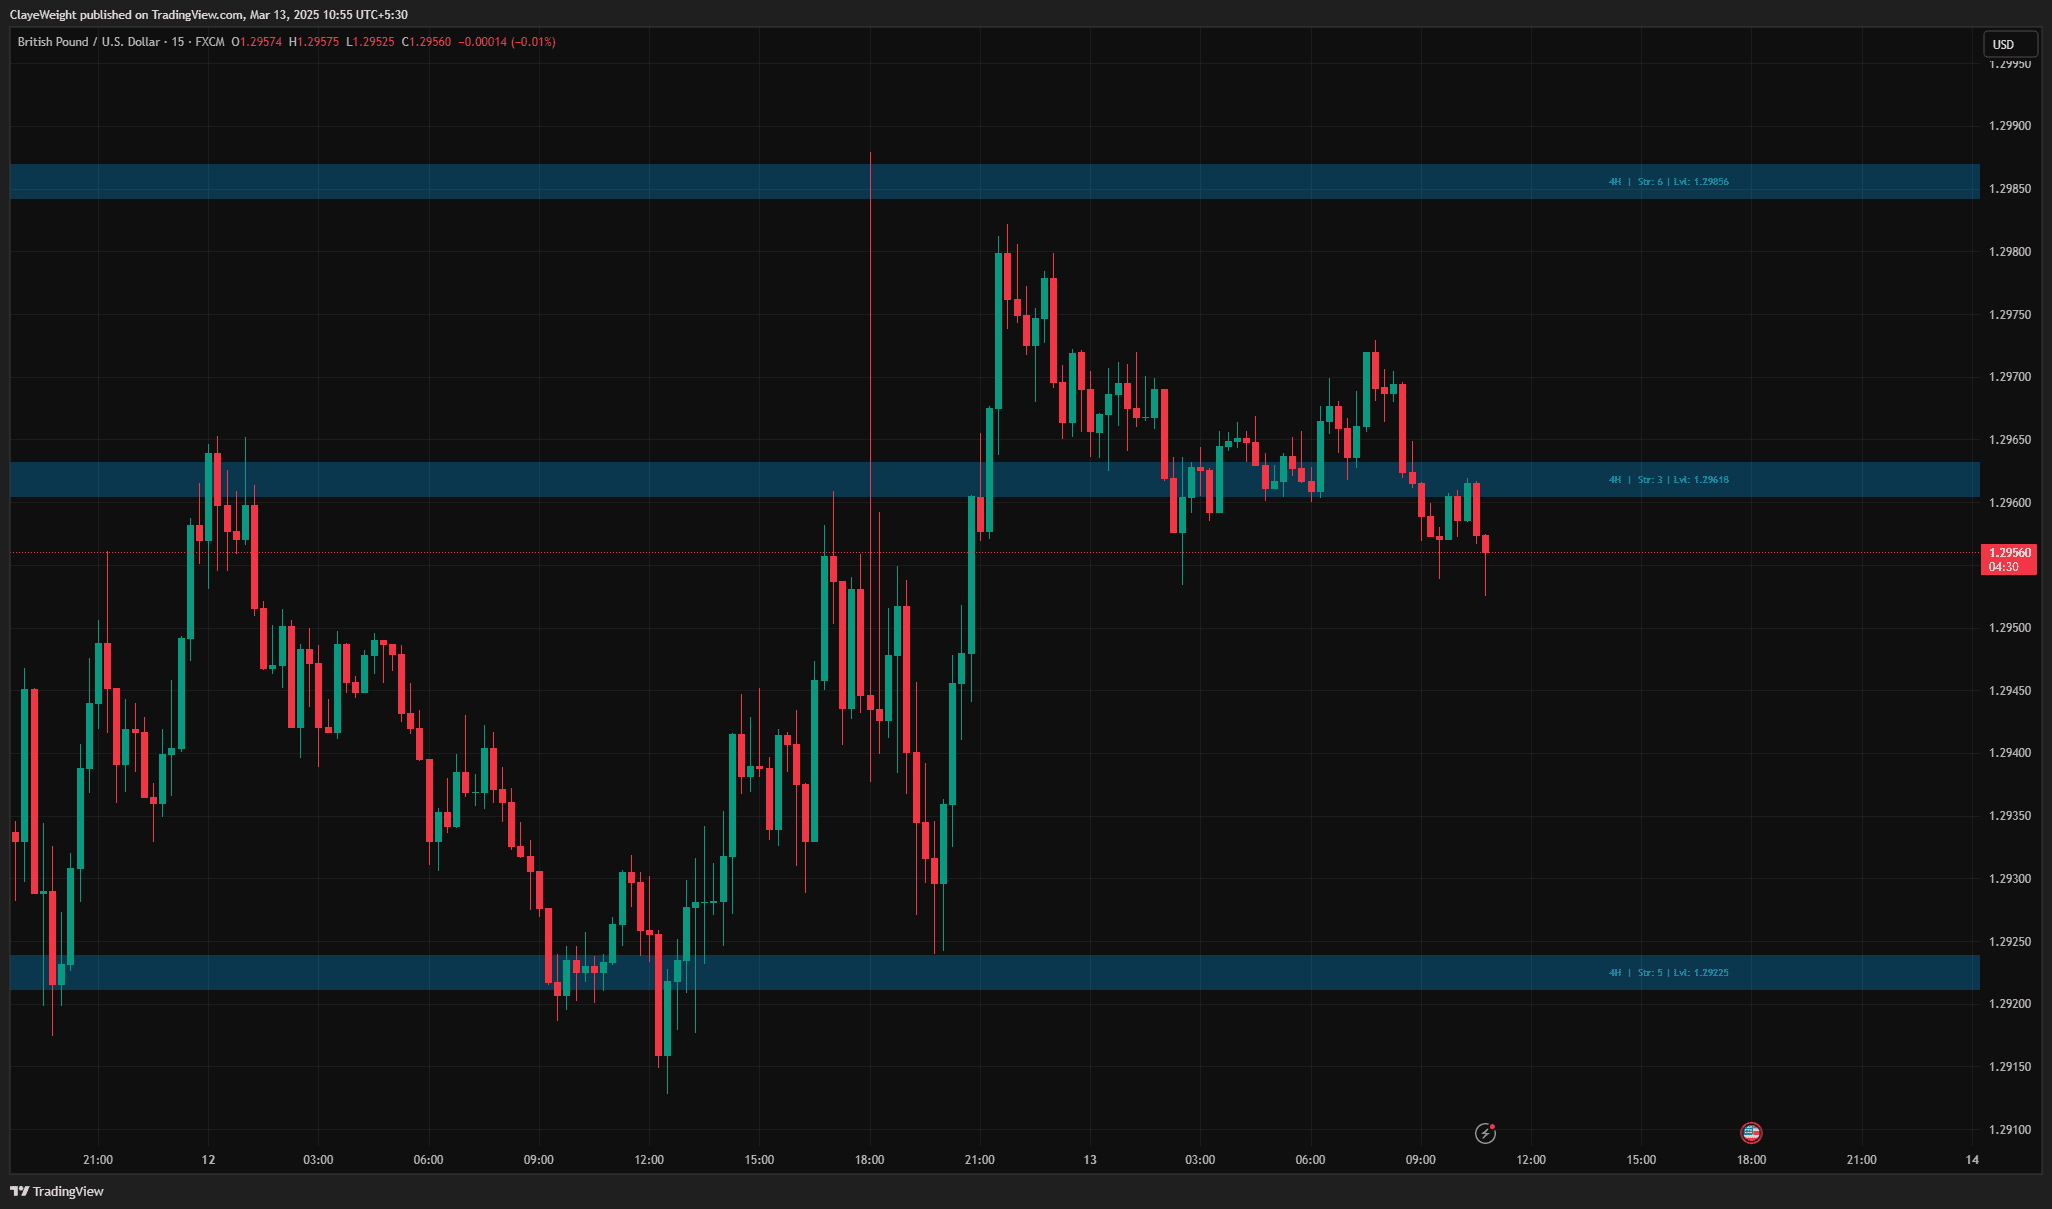
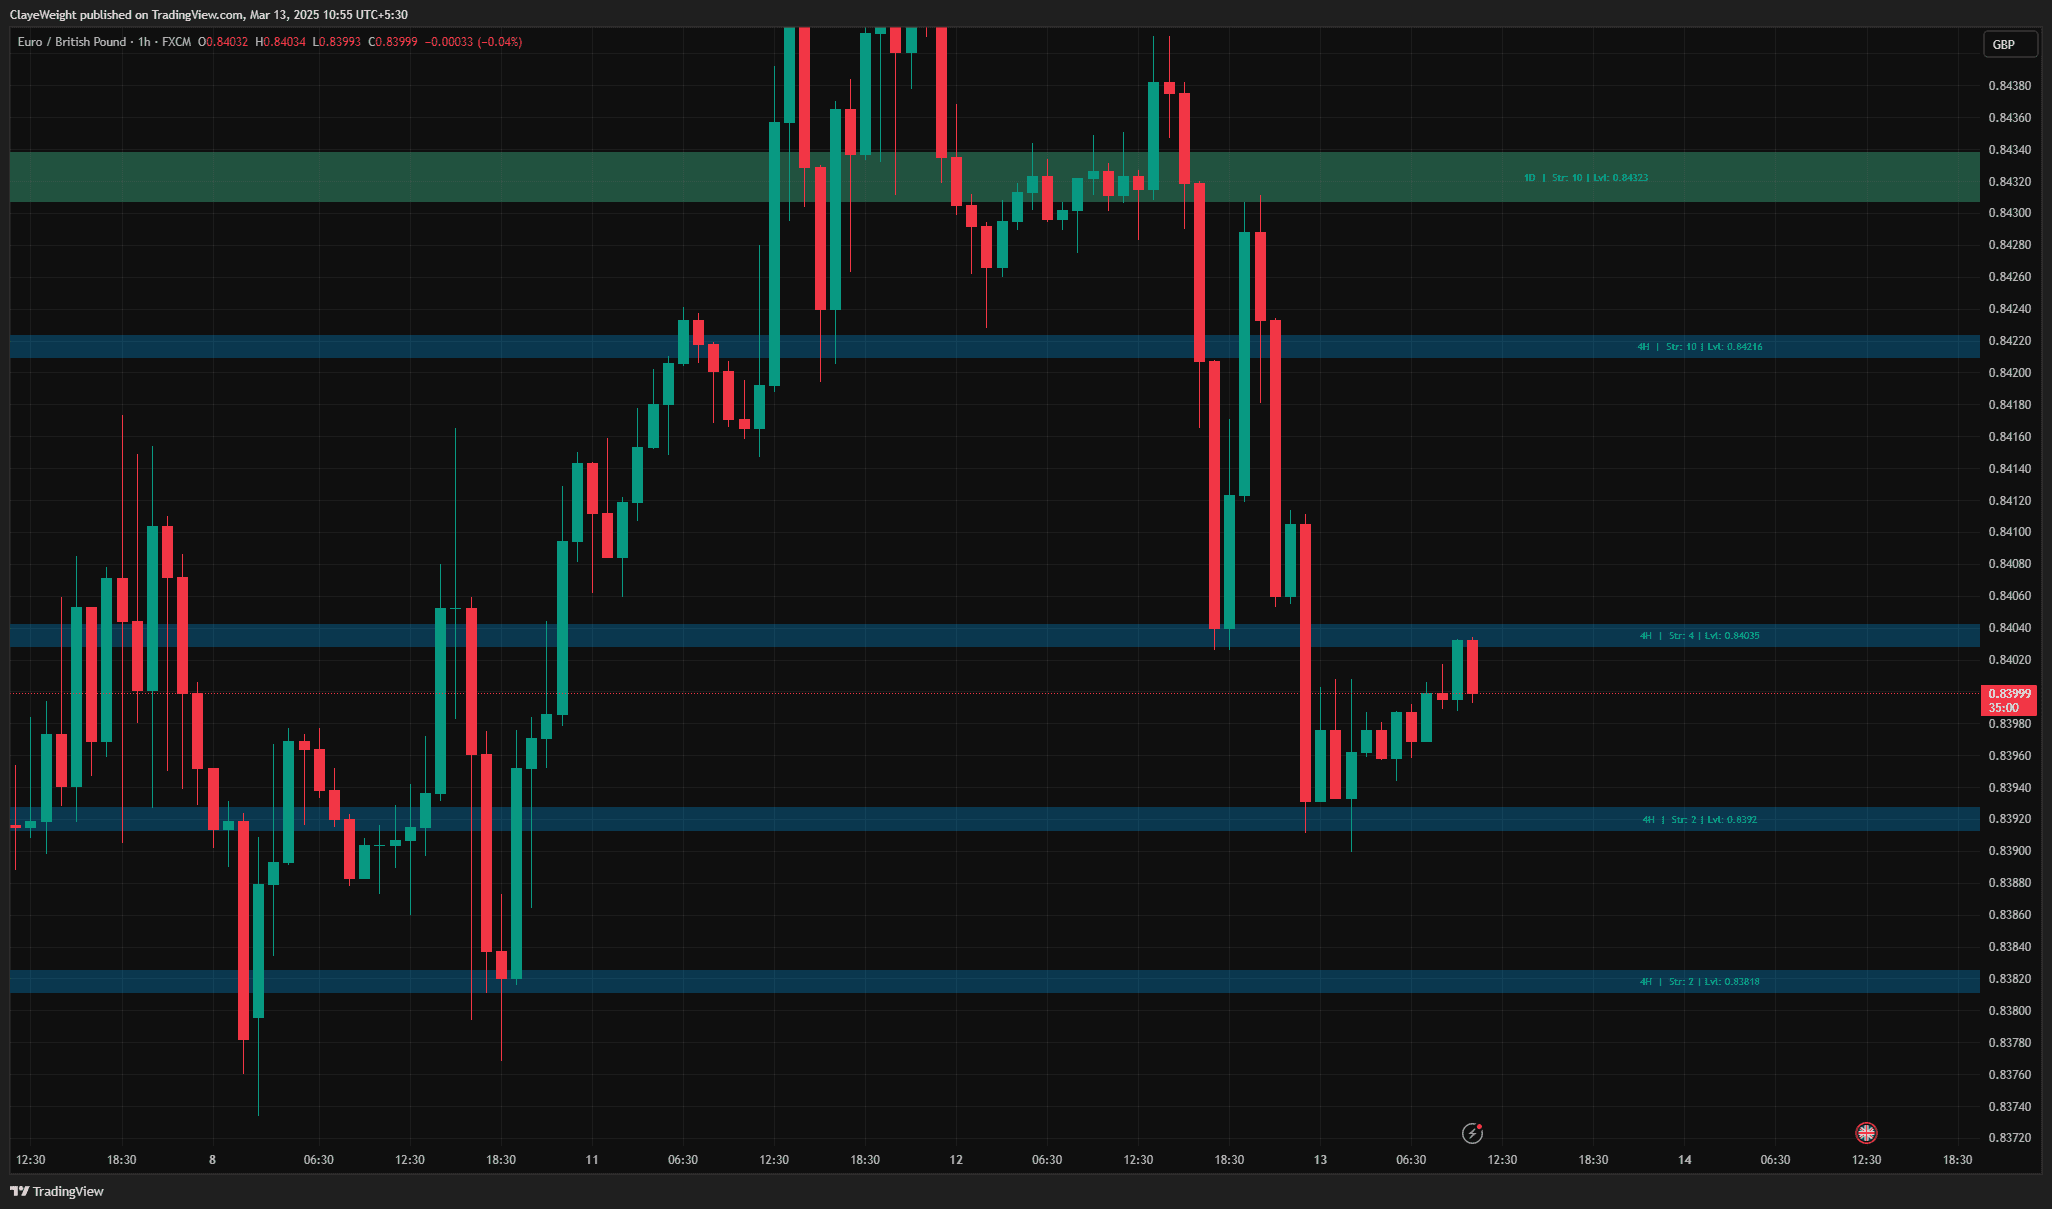
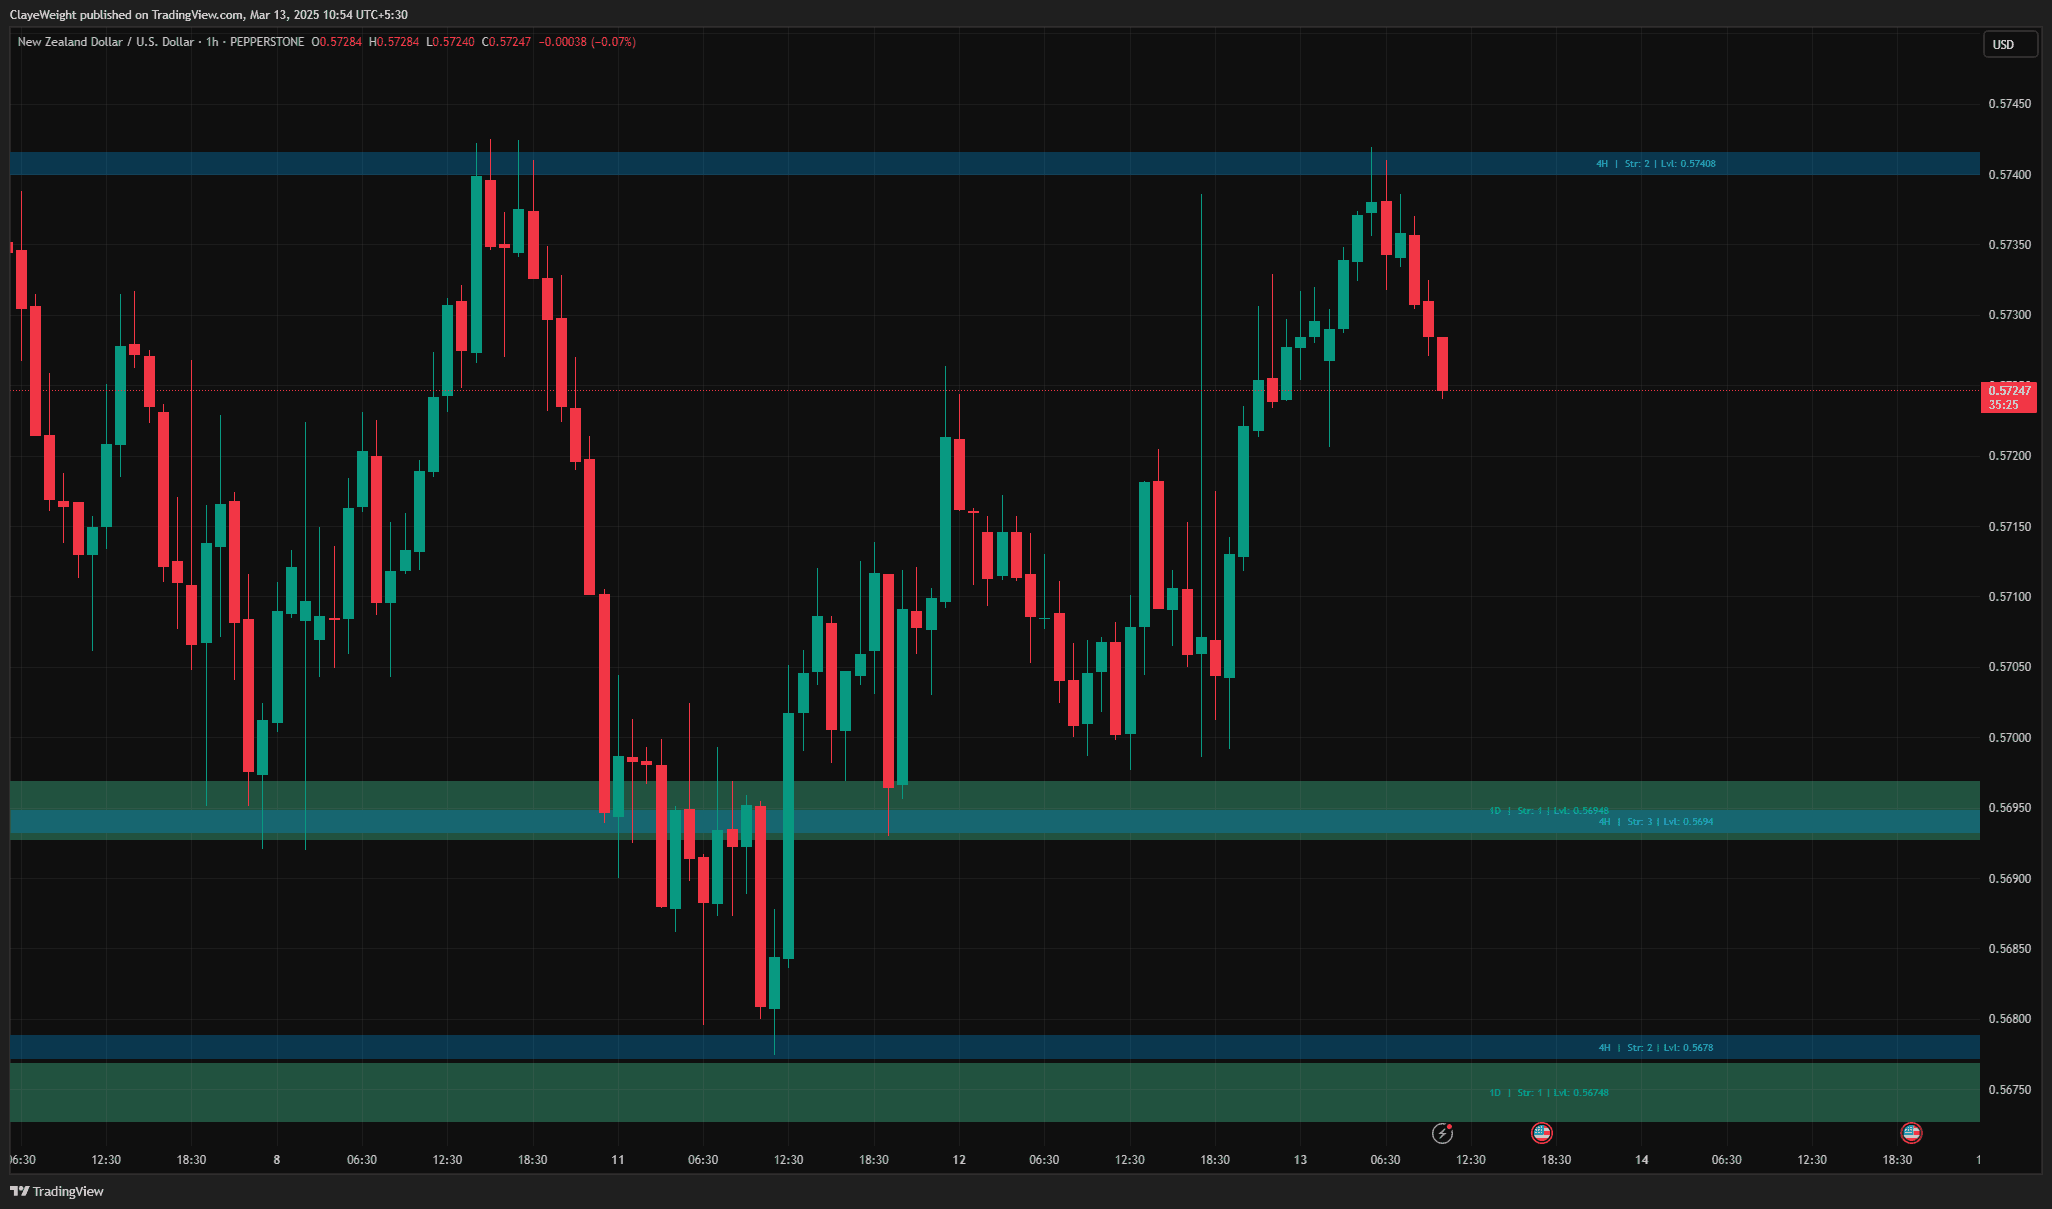
Not all support and resistance is created equal. This indicator scores S/R levels based on number of touches, reaction strength, and time validity. Focus on the levels that actually matter.
What's Included
How Support & Resistance Strength works
Support and resistance levels are not created equal. A price level that has been tested many times, produced sharp reactions, and remains recent tends to matter far more than a line drawn from a single, months-old touch. Support-and-resistance strength scoring is the idea of ranking each level by objective evidence so your chart highlights the zones price actually respects.
The common factors traders weigh are how many times price has touched a level, how strong the rejection was each time (a long wick or an immediate reversal counts more than a shallow pause), and how recently the level was last active. Levels that have been decisively broken lose validity, while untested nearby zones carry less confirmation. Combining these into a single score lets you separate high-conviction levels from noise.
The practical payoff is focus. Instead of a chart cluttered with a dozen horizontal lines, you concentrate on the two or three levels most likely to produce a reaction, and you size your expectations accordingly. A strongly rated level is a place to watch for reactions, not a guarantee price will turn there.
When to use it
- Range-bound or consolidating markets where clean, repeatedly tested levels define the boundaries you can trade against.
- Planning entries, stops, and take-profit targets around the levels most likely to hold or break.
- Filtering a messy chart down to the few S/R zones that carry the most historical weight.
- Confirming confluence when a strong level lines up with another signal such as a moving average or a session high or low.
When it's not the right tool
- During strong trending or breakout expansion, when price slices through even well-tested levels and horizontal zones lose their edge.
- As a standalone entry trigger; a high score signals where to watch, not a mechanical buy or sell.
- On very low timeframes where thin liquidity and noise inflate touch counts without meaningful reactions.
Source Code Preview
Get the full PineScript v6 source code—use it as a foundation and build on top of it with HorizonAI.
Frequently asked questions
Does a high strength score mean the level will definitely hold?
No. A higher score means the level has more historical evidence behind it and is statistically more likely to produce a reaction, but any level can break. Strong levels often break with force once they give way, so always pair the read with your own risk management.
How many touches make a level strong?
There is no universal number, and quality matters more than raw count. Two touches with sharp, decisive rejections can outweigh five shallow tags. Scoring approaches typically blend touch count with reaction strength and recency rather than relying on touches alone.
Can I use this on any market or timeframe?
The concept applies across forex, crypto, indices, and stocks, and across timeframes. Higher timeframes generally produce more reliable levels because each touch represents more participation. With HorizonAI you can adjust which factors weigh most heavily to suit your market and style.
Related Scripts
 Pro
ProMarket Structure
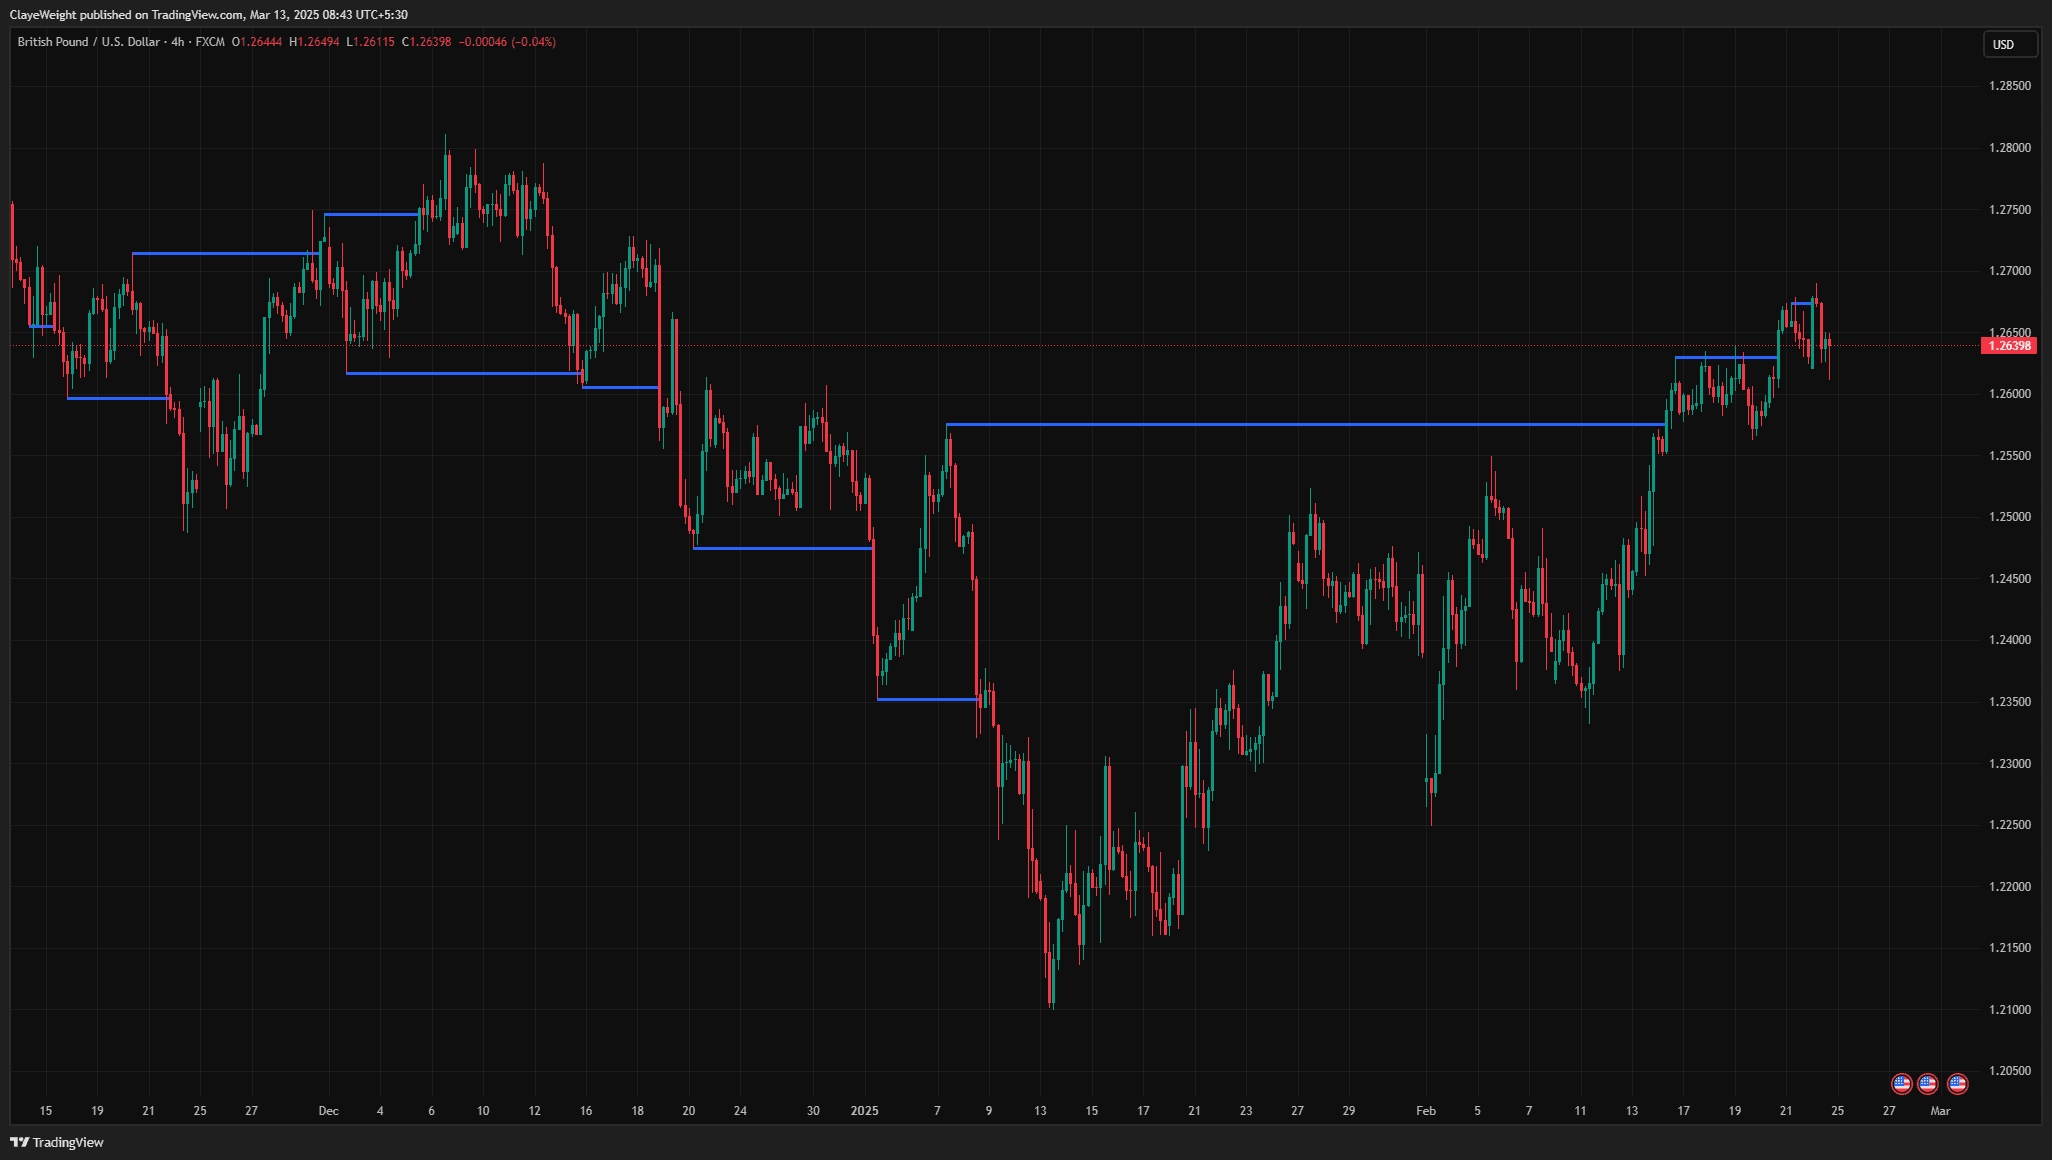
Automatically maps swing highs and lows with break of structure detection.
 Pro
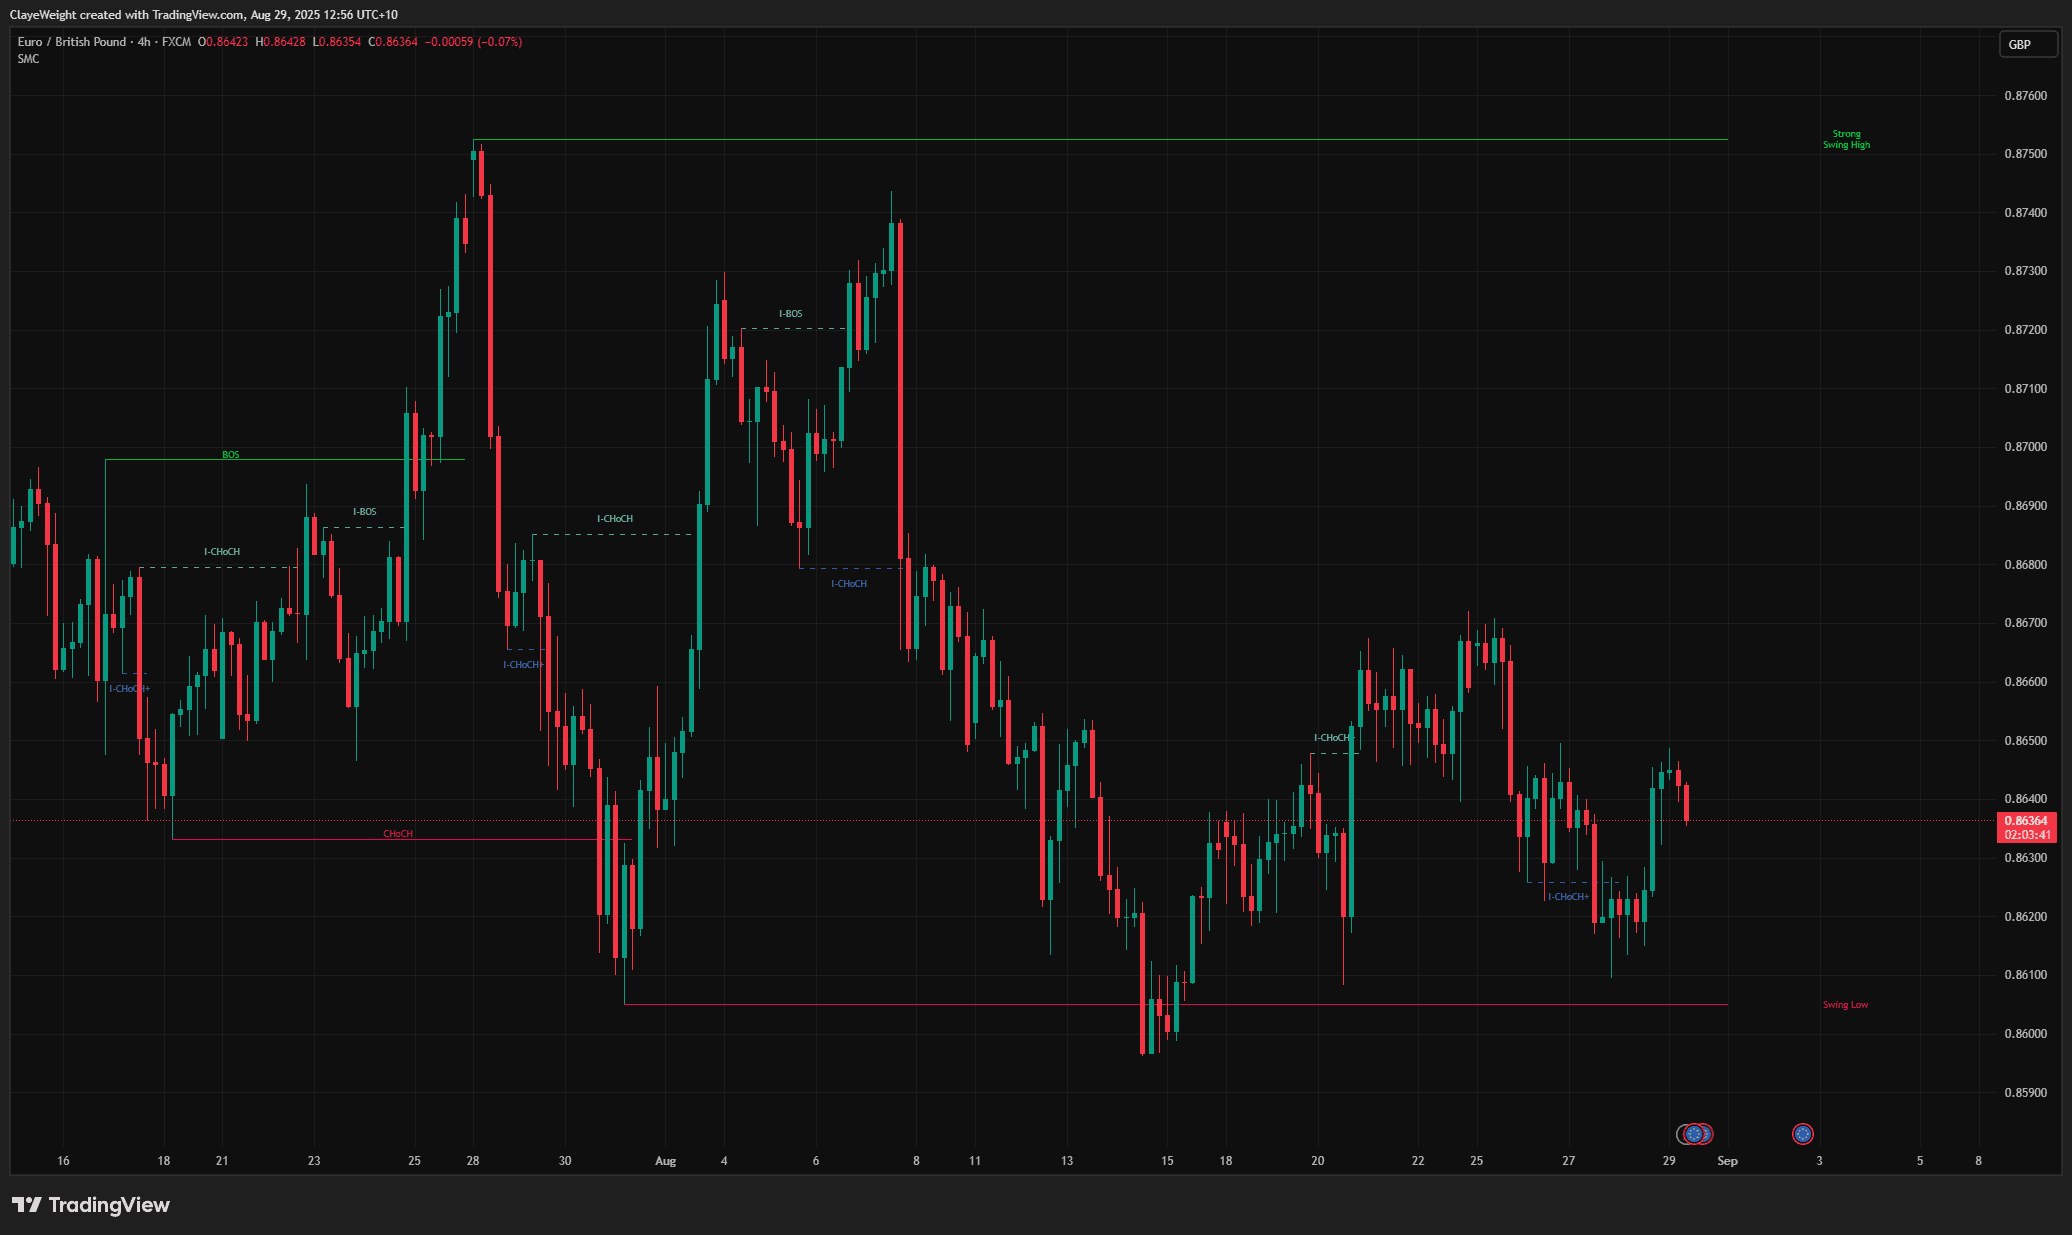
ProSMC Market Structure Pro
Advanced Smart Money Concepts with internal and swing structure mapping.
 Free
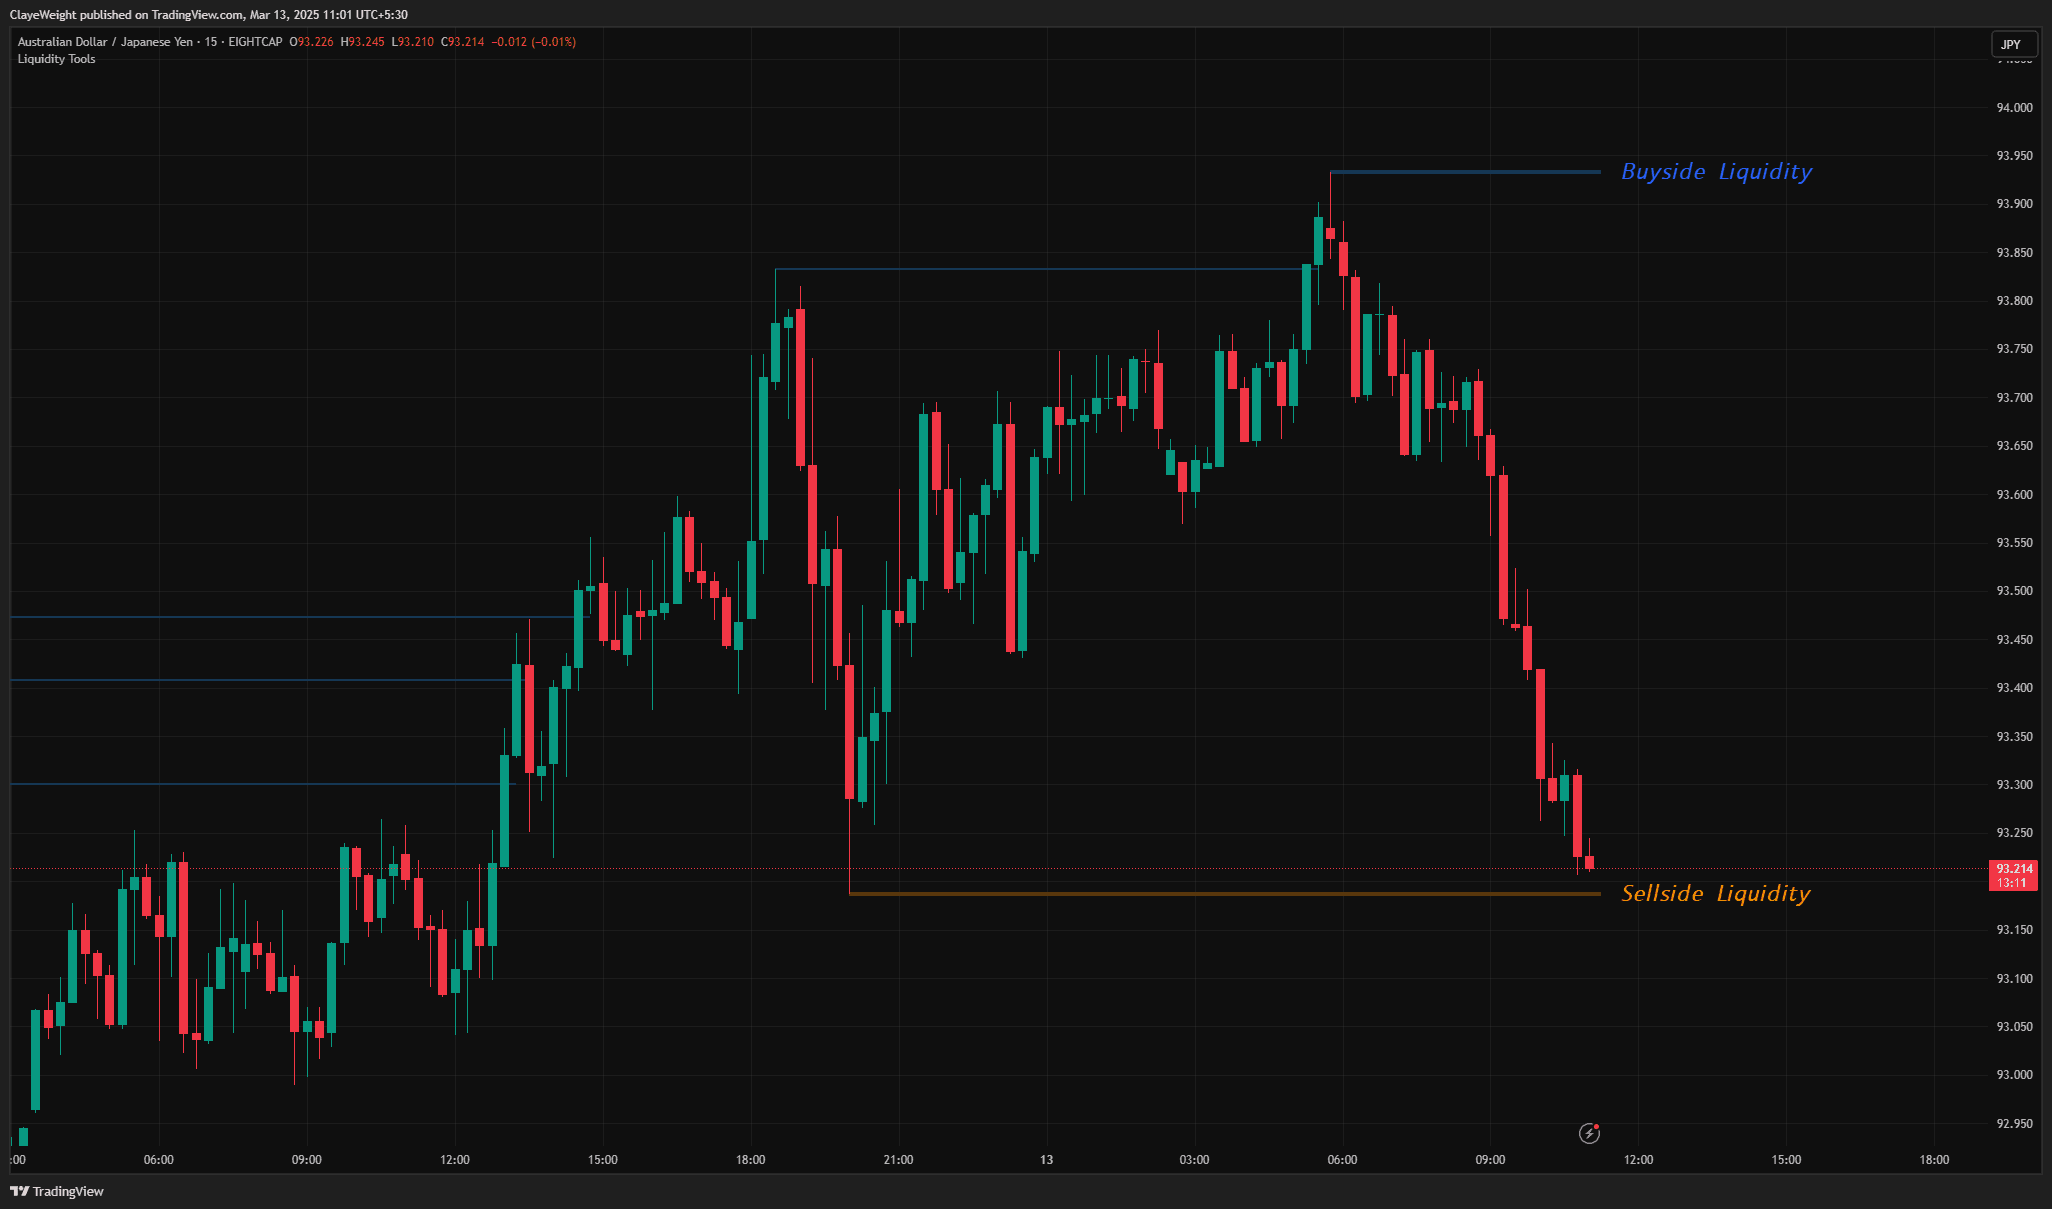
FreeLiquidity Levels
A comprehensive suite designed to identify and track institutional liquidity zones, stop hunts, and more.
Get access to all 23+ scripts
Full source code, alert templates, and the perfect base to build on with HorizonAI. Join 10,000+ traders.