
Build an Ichimoku Cloud Indicator in Pine Script v6
By HorizonAI Team · 13 min read · Intermediate
How to Build an Ichimoku Cloud Indicator in Pine Script v6
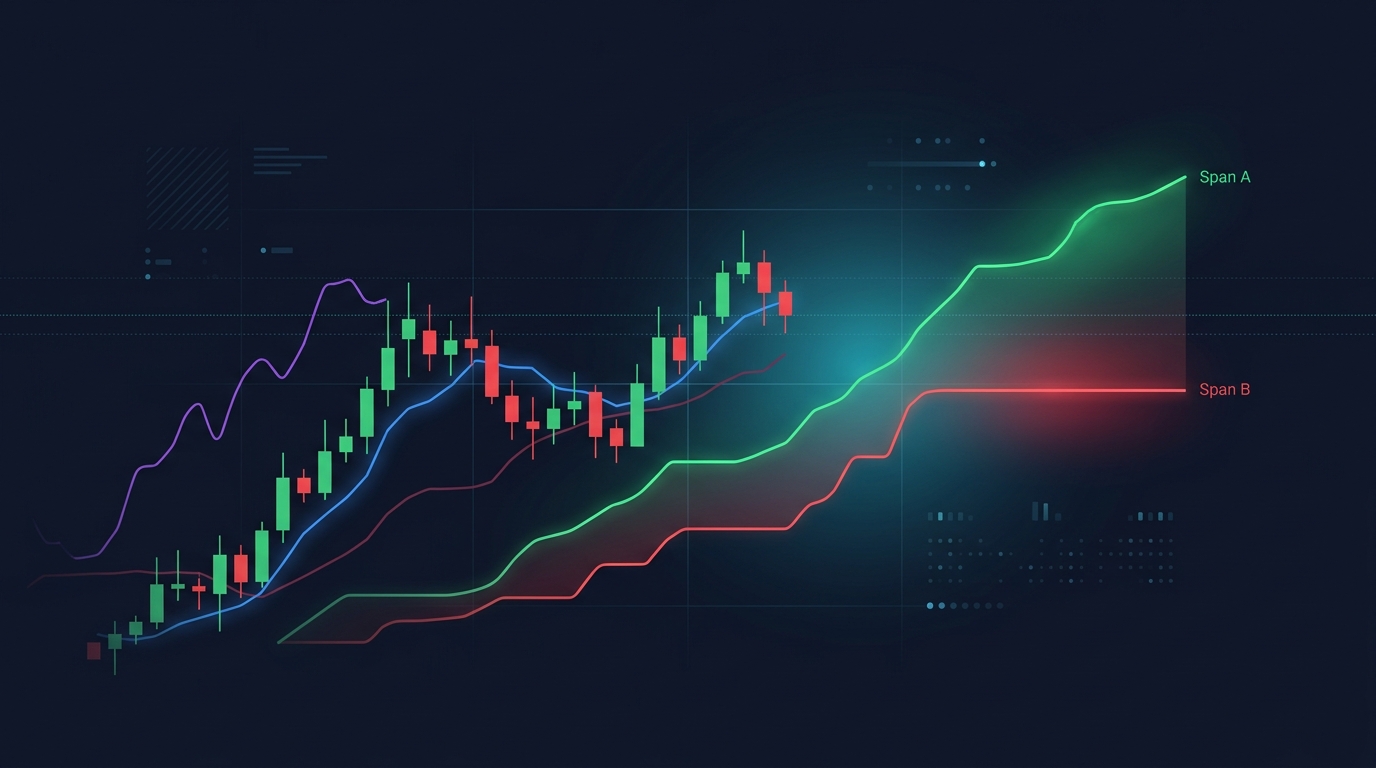
An Ichimoku script can look wrong even when every formula is right. The usual culprit is displacement: the two cloud boundaries must be drawn forward, while the Chikou Span must be drawn backward. Get those offsets wrong and you no longer have an Ichimoku chart, just five moving lines with misleading timing.
Short answer: Build Ichimoku in Pine Script v6 by averaging the highest high and lowest low over 9, 26, and 52 bars. Plot Tenkan-sen and Kijun-sen on the current bar, plot Senkou Spans A and B 26 bars forward with offset, plot the Chikou Span 26 bars backward, then use fill() to color the space between the forward spans.
The complete indicator below uses the traditional 9/26/52/26 settings as editable inputs, colors the Kumo green or red, and creates alerts when price crosses the current calculated cloud boundary. It is an indicator, not a backtested strategy. That distinction matters because a forward-plotted cloud is visual context, while a strategy needs explicit, non-lookahead entry and exit rules.
Know the five calculations before writing code
Ichimoku Kinko Hyo is one coordinated system, not five independent indicators. Four values come from midpoint calculations, so they respond to the range of price over a lookback window rather than averaging closes like an SMA.
| Component | Formula | Standard length | Where it plots |
|---|---|---|---|
| Tenkan-sen, conversion line | (highest high + lowest low) / 2 | 9 | Current bar |
| Kijun-sen, base line | (highest high + lowest low) / 2 | 26 | Current bar |
| Senkou Span A | (Tenkan + Kijun) / 2 | Derived | 26 bars forward |
| Senkou Span B | (highest high + lowest low) / 2 | 52 | 26 bars forward |
| Chikou Span, lagging line | Close | Derived | 26 bars backward |
The Tenkan-sen is the fast range midpoint. The Kijun-sen is the slower midpoint and is often treated as the baseline. Their average becomes Senkou Span A. Senkou Span B uses the longer 52-bar range midpoint. The area between A and B is the Kumo, or cloud.
A green cloud means Span A is above Span B. A red cloud means Span A is below Span B. That color is descriptive, not a trade order. A cloud can be green while price is below it, and a red cloud can sit beneath price because the cloud is projected ahead.
Pine’s built-in ta.highest(), ta.lowest(), math.max(), and math.min() are the right tools for those calculations. TradingView documents these namespaces and their functions in its Pine built-ins reference. Check the reference when you want to extend the script with other built-ins.
Set up the indicator and editable inputs
Open a new TradingView Pine Editor tab, replace its contents, and save the script as an indicator. Start with overlay = true so every Ichimoku element is drawn over price rather than in a lower pane.
The four input values below preserve the conventional structure:
- Conversion length: 9 for Tenkan-sen.
- Base length: 26 for Kijun-sen.
- Span B length: 52 for the slow cloud edge.
- Displacement: 26 for the forward cloud and backward Chikou Span.
Keep displacement independent from Kijun length in the input panel. They are both 26 in the traditional setup, but separating them makes experiments explicit and prevents a hidden change to the chart geometry.
Paste this complete Ichimoku Cloud indicator
This version plots all five components, fills the cloud, and marks price crossing above the cloud top or below the cloud bottom. The alerts intentionally use the unshifted values calculated on the current bar. That gives an alert condition that is available now, instead of trying to compare current price to a visually projected value from the future.
//@version=6
indicator("Ichimoku Cloud Builder", shorttitle = "Ichimoku", overlay = true)

// Traditional Ichimoku settings, left editable for testing.
conversionLength = input.int(9, "Tenkan-sen Length", minval = 1)
baseLength       = input.int(26, "Kijun-sen Length", minval = 1)
spanBLength      = input.int(52, "Senkou Span B Length", minval = 1)
displacement     = input.int(26, "Displacement", minval = 0)
showSignals      = input.bool(true, "Show Cloud Cross Signals")

// Range midpoint helper used by Tenkan, Kijun, and Span B.
rangeMidpoint(int length) =>
    (ta.highest(high, length) + ta.lowest(low, length)) / 2.0

// Ichimoku calculations on the current bar.
tenkan = rangeMidpoint(conversionLength)
kijun = rangeMidpoint(baseLength)
spanA = (tenkan + kijun) / 2.0
spanB = rangeMidpoint(spanBLength)

// Plot current-bar lines.
plot(tenkan, "Tenkan-sen", color = color.blue, linewidth = 2)
plot(kijun, "Kijun-sen", color = color.maroon, linewidth = 2)

// Plot leading spans forward. These plot IDs are used by fill().
spanAPlot = plot(spanA, "Senkou Span A", offset = displacement, color = color.new(color.green, 0), linewidth = 1)
spanBPlot = plot(spanB, "Senkou Span B", offset = displacement, color = color.new(color.red, 0), linewidth = 1)

// Color the projected Kumo according to which span is on top.
cloudColor = spanA >= spanB ? color.new(color.green, 85) : color.new(color.red, 85)
fill(spanAPlot, spanBPlot, color = cloudColor, title = "Kumo Cloud")

// Plot the lagging close backward, never forward.
plot(close, "Chikou Span", offset = -displacement, color = color.purple, linewidth = 2)

// Current-bar cloud boundaries for non-lookahead alert logic.
cloudTop = math.max(spanA, spanB)
cloudBottom = math.min(spanA, spanB)
bullishCloudCross = ta.crossover(close, cloudTop)
bearishCloudCross = ta.crossunder(close, cloudBottom)

plotshape(showSignals and bullishCloudCross, title = "Bullish Cloud Cross", style = shape.triangleup, location = location.belowbar, color = color.lime, size = size.tiny, text = "Kumo+")
plotshape(showSignals and bearishCloudCross, title = "Bearish Cloud Cross", style = shape.triangledown, location = location.abovebar, color = color.red, size = size.tiny, text = "Kumo-")

alertcondition(bullishCloudCross, title = "Ichimoku Bullish Cloud Cross", message = "{{ticker}} crossed above the current Ichimoku cloud top.")
alertcondition(bearishCloudCross, title = "Ichimoku Bearish Cloud Cross", message = "{{ticker}} crossed below the current Ichimoku cloud bottom.")
The first 52 bars will not have a fully formed Span B, because the script lacks enough history to calculate a 52-bar high and low. That is expected. A na cloud at the left edge is more honest than forcing an incomplete value onto the chart.
The code uses plot IDs returned by plot() as inputs to fill(). This is the clean way to create a colored Kumo. TradingView’s plotting documentation covers plot output and fills, including the fact that fill() works between compatible plot objects. Use it as the reference when you add display controls or alternative plot styles.
Get the 26-bar displacement right
The displacement is where many hand-built versions fail. offset = displacement draws each Senkou value to the right of the bar where Pine calculated it. With the standard setting, Span A and Span B calculated today appear 26 bars ahead. offset = -displacement draws today’s close 26 bars to the left for Chikou.
That means these lines use different visual locations:
- Tenkan and Kijun: current calculation, current bar.
- Span A and Span B: current calculation, 26 bars forward.
- Chikou: current close, 26 bars backward.
Do not try to obtain a leading cloud by referencing future bars such as spanA[-26]. Negative historical indexing is not a valid way to access future information, and even an apparently clever workaround would make strategy logic dishonest. offset changes the drawing position only. It does not make future price data available.
There is a second, subtler point in the alert code. The line you see directly above or below current price may be a cloud value calculated 26 bars ago and projected onto today’s chart position. The script’s bullishCloudCross instead compares close with max(spanA, spanB) calculated on this bar. That is a valid current-bar event, but it is not identical to “price crossed the cloud drawn at today’s x-position.” Name your alerts accordingly.
If you later turn the visual idea into a strategy, keep that distinction front and center. Our guide to Pine Script repainting and reliable fixes explains why forward-looking logic, higher-timeframe data, and intrabar assumptions can make historical results look cleaner than live behavior.
Read the finished chart without turning it into a black box
The indicator gives you chart structure. It does not decide position size, stop placement, or whether a market is liquid enough for your plan. Use each line for a specific observation rather than stacking every possible Ichimoku rule into one signal.
Use the cloud as a regime map
When close is above both current cloud boundaries, the current calculation places price above the cloud. When close is below both, it is below. Between them is a transition area. A simple rule set might only investigate long setups when close is above cloudTop and short setups when close is below cloudBottom.
The projected cloud also shows how the range-based structure might develop if no new price information arrives. It is not a forecast. Each new candle recalculates its own Span A and Span B, which is why the far-right cloud keeps extending as new bars print.
Use Tenkan and Kijun for timing, not proof
A Tenkan cross above Kijun is a faster momentum change than a cloud break. It can occur inside the cloud, below it, or above it. Those locations mean different things, so a raw crossover should not carry the same weight in every regime.
For example, you can require all three conditions before flagging a bullish watchlist setup: close above the current cloud top, Tenkan above Kijun, and a Tenkan crossover within the past three bars. That is more selective than treating every blue-red crossover as an entry.
Use Chikou as a historical clearance check
Chikou places today’s close against price action from 26 bars ago. Many traders look for it to be above prior price for bullish context or below prior price for bearish context. On a crowded chart, hide it temporarily with the indicator’s Style panel to inspect the cloud and conversion/base relationship first.
A useful build exercise is adding a toggle that only colors a bar when Chikou clears the high or low from 26 bars ago. Do it with current-bar series references, then verify the result bar by bar. That discipline transfers to other composite scripts such as a combined RSI and MACD indicator.
Create alerts that match the code’s actual event
The two alertcondition() calls make named conditions available when you create a TradingView alert. Select the indicator, then choose either Ichimoku Bullish Cloud Cross or Ichimoku Bearish Cloud Cross in the Condition menu. TradingView’s alert documentation explains that alertcondition() creates selectable alert conditions for indicators, while the alert itself is configured from the chart interface. Review the official alert concepts before changing frequency or messages.
Use Once Per Bar Close for a first pass. A price that trades through a boundary during an open candle can return before the close. Bar-close alerts make the event match a closed-bar reading and reduce surprises during volatile sessions.
The alert markers in the code are deliberately simple. They show an upward triangle when close crosses over the current calculated cloud top and a downward triangle when it crosses under the current calculated cloud bottom. They do not claim that every cross is a trade. You still need a defined exit, risk amount, session rule, and test method before converting the idea into a strategy.
Common Ichimoku coding mistakes
❌ Mistake: Plotting Span A and Span B with no positive offset. The formulas may be right, but the Kumo sits on the wrong bars and loses its leading structure.
✅ Do this: Use offset = displacement on both Span plots. Start with 26 and change the input only when you intentionally test a different visual configuration.
❌ Mistake: Plotting Chikou with a positive offset. That turns a lagging comparison line into another forward line, which reverses its purpose.
✅ Do this: Use offset = -displacement and plot close. Keep it purple or another distinct color so it is not mistaken for price.
❌ Mistake: Triggering an alert from the projected cloud as though it were a current-bar value. This often leads to confusing labels and accidental lookahead logic in a later strategy.
✅ Do this: Compare price with current spanA and spanB values for an event available on the present bar. If you want a visual-position comparison, document exactly which historical cloud values you are using and test it carefully.
❌ Mistake: Declaring a strategy from an indicator cross without an exit. A chart marker is not a strategy rule.
✅ Do this: Define a stop-loss, a target or exit trigger, and position sizing before adding strategy.entry() and strategy.exit(). See the complete structure in this VWAP mean-reversion strategy build, even though its setup logic is different.
Pro tips for adapting the build
Keep the standard inputs visible while testing. A 9/26/52 cloud is a common baseline across timeframes. If you test 7/22/44 or another variant, give it a separate saved indicator name so you can compare charts without forgetting which setting produced each observation.
Add one filter at a time. Start with cloud position. Next add Tenkan versus Kijun. Only then consider a Chikou clearance rule or a higher-timeframe trend filter. Changing four rules at once makes it impossible to know why the signals changed.
Make signals optional. The showSignals input lets you keep the indicator useful as a discretionary charting tool. This same input pattern works well in oscillator builds such as a WaveTrend Pine Script indicator.
Convert visual rules into testable rules slowly. For example, write “long only when close is above the current cloud top and Tenkan crosses above Kijun” before touching strategy code. Then decide whether the stop is a Kijun close, a fixed ATR multiple, or a swing low. A clear sentence exposes missing decisions.
Generating this without writing the code yourself
You can ask HorizonAI to generate the same Pine Script v6 indicator from a precise specification, then edit the result in chat or in its browser-based Monaco editor. It generates compile-checked Pine Script, MQL5, and NinjaScript code, but it does not place trades or connect to a broker.
Build a Pine Script v6 overlay indicator named “Ichimoku Cloud Builder.” Add editable inputs for Tenkan 9, Kijun 26, Senkou Span B 52, and displacement 26. Calculate each range midpoint with highest high plus lowest low divided by two. Plot Tenkan and Kijun on the current bar. Plot Senkou Span A and B 26 bars forward, fill the cloud green when A is above B and red otherwise, and plot Chikou as close 26 bars backward. Add optional triangles and alertcondition calls when close crosses above the current cloud top or below the current cloud bottom. Do not make it a strategy.
If you already have a Pine version, you can also ask for a conversion to MQL5 or NinjaScript in either direction, then refine the calculations and visuals before you use the code on its native platform. Try it free →
FAQs
What are the default Ichimoku settings?
The traditional settings are Tenkan-sen 9, Kijun-sen 26, Senkou Span B 52, and displacement 26. They are a baseline, not a requirement, so keep them as editable inputs when building a script.
Does plotting the cloud 26 bars ahead repaint?
No. A positive plot offset only moves a value already calculated on the current bar to a later chart position. Repainting risk appears when a script uses information that was not available at the decision bar, or when its behavior changes during an open candle.
Why are there blank Ichimoku values at the beginning of the chart?
Span B needs 52 bars of high and low data before its midpoint can be calculated. Pine returns incomplete values as na, so the cloud begins only after enough history exists.
Can I backtest this Ichimoku indicator directly?
No. Indicators plot and alert; they do not produce strategy-test results by themselves. Build a separate strategy() script with explicit entries, exits, stops, and sizing rules if you want to test a defined system.
Final thoughts
A correct Ichimoku build comes down to simple midpoint math and disciplined chart placement. Put Tenkan and Kijun on the current bar, move the cloud forward, move Chikou backward, and make alert logic honest about whether it uses current or historical values.
One practical habit pays off: after every code change, hover the latest bar and a bar 26 periods back. Confirm that the visible cloud and Chikou locations match the calculations you intended before adding another condition.
Related articles
- Pine Script Repainting: Why It Happens and How to Fix It — Keep visual offsets and strategy logic from creating false confidence.
- Pine Script Tutorial for Beginners — Learn the core structure of TradingView indicators and strategies.
- Build a VWAP Mean Reversion Strategy in Pine Script v6 — Turn clear conditions into testable entries and exits.
- How to Code a Combined RSI + MACD Indicator in Pine Script v6 — Build another multi-line confirmation tool from scratch.
- Code an RSI Divergence Indicator in Pine Script v6 — Work with pivots and visual signal annotations.
- Build a WaveTrend Oscillator in Pine Script v6 — Add a lower-pane momentum indicator to your toolkit.
- Automate a Supertrend Strategy with Alerts in Pine Script v6 — See a strategy-oriented alert workflow.
- How to Backtest a Trading Strategy — Plan a useful test before trusting a new rule set.
Questions about Ichimoku Cloud indicators? Join our Discord to discuss with other traders!