
Code an RSI Divergence Indicator in Pine Script v6
By HorizonAI Team · 14 min read · Intermediate
How to Code an RSI Divergence Indicator in Pine Script v6
RSI divergence is easy to spot after a move has played out and hard to identify consistently in real time. The practical fix is to make the script wait for confirmed RSI swing points, compare those points with price at the same bars, then reject signals that are too close together, too far apart, or too weak.
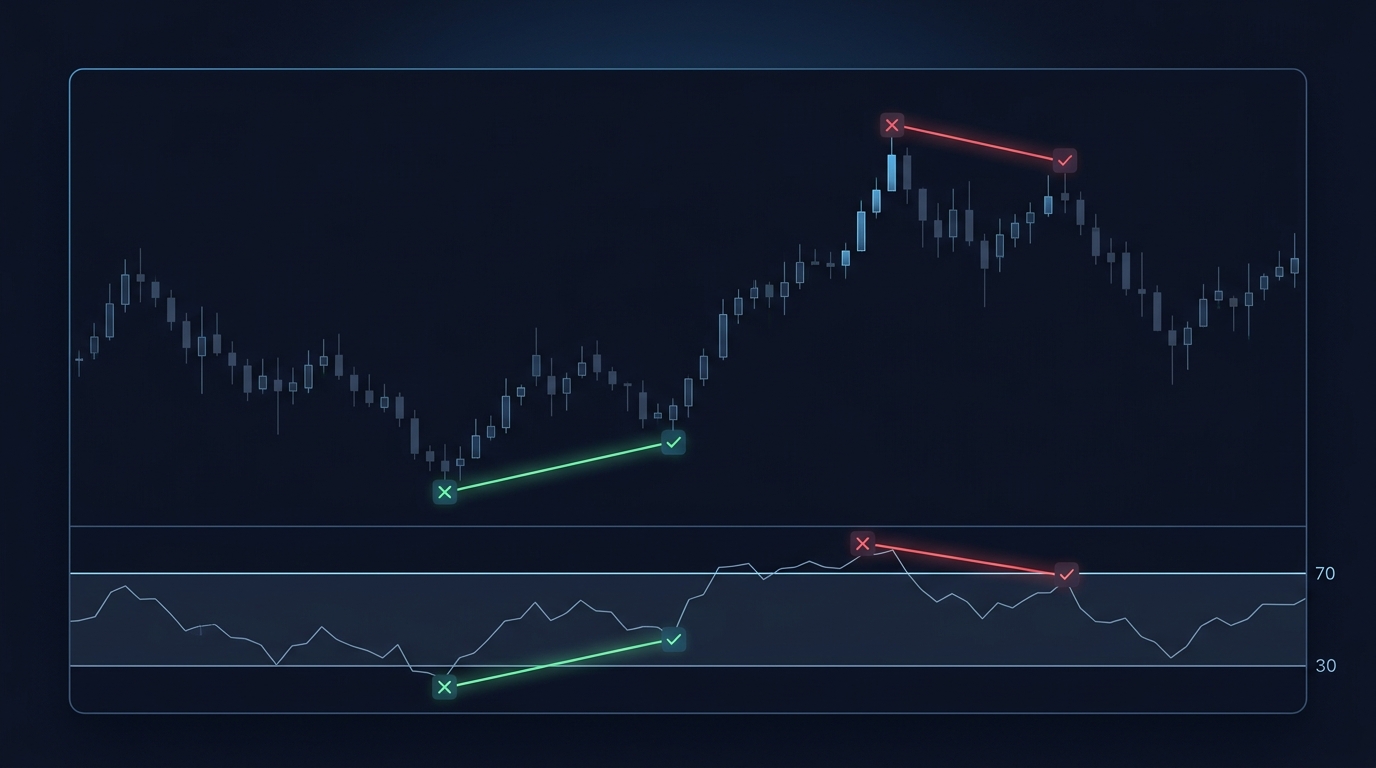
Short answer: code RSI divergence by finding confirmed pivots on the RSI, then comparing the current pivot with the preceding pivot and the matching price low or high. A regular bullish divergence is a lower price low with a higher RSI low; a regular bearish divergence is a higher price high with a lower RSI high. The indicator below uses 5-left/5-right pivots, a 5-to-60-bar swing range, a minimum RSI difference, zone filters, labels, lines, and alert conditions.
The important constraint is timing. A pivot with five right bars is only known five candles after the turning candle. That delay is confirmation, not a signal that changes history. Once you accept it, divergence becomes a repeatable chart rule rather than a line you redraw until it looks convincing.
Start with the divergence rules you actually want to detect
RSI divergence compares momentum, represented by the Relative Strength Index, with the direction of price swings. It is a relationship between two completed swings, not a comparison of two adjacent candles. If you need a refresher on what RSI measures versus another momentum tool, see RSI vs. MACD.
| Type | Price action | RSI action | Typical use |
|---|---|---|---|
| Regular bullish | Lower low | Higher low | Potential downside exhaustion or reversal setup |
| Regular bearish | Higher high | Lower high | Potential upside exhaustion or reversal setup |
| Hidden bullish | Higher low | Lower low | Pullback continuation in an uptrend |
| Hidden bearish | Lower high | Higher high | Rally continuation in a downtrend |
This build plots all four types, but the regular signals are the core artifact. Hidden divergence is included because it uses the same confirmed-pivot data and is useful when you want a continuation filter rather than a reversal alert.
A divergence line is only meaningful when both ends refer to equivalent swing points. Comparing the latest close to an RSI value from three bars ago produces plenty of marks, but it doesn't describe a price swing. Confirmed pivots give the comparison a fixed bar index and a fixed value.
Build rule: use RSI pivots for the trigger, then read
low[rightBars]orhigh[rightBars]to get the price at the exact pivot candle.
Why a naive RSI divergence script fills the chart with noise
The common bad implementation checks whether RSI rose while price fell over the last two or three bars. That catches routine candle-to-candle disagreement, not divergence. On a volatile five-minute chart, it can label nearly every small pullback.
A usable detector needs four controls:
- Pivot width:
leftBars = 5andrightBars = 5require a meaningful local turn on both sides of the RSI pivot. - Swing distance: require the two pivots to be at least 5 bars apart and no more than 60 bars apart. This avoids micro-swings and comparisons to stale structure.
- Minimum RSI delta: require at least 3 RSI points of separation. An RSI low of 31.2 versus 31.8 is rarely worth a label.
- Momentum zones: for regular bullish divergence, require at least one RSI pivot below 40; for regular bearish divergence, require at least one pivot above 60. This keeps mid-range fluctuations from dominating the output.
These defaults are deliberately conservative. On liquid intraday markets, try 3-left/3-right pivots and a 3-point delta first. On four-hour or daily charts, 5-left/5-right and a 4- to 5-point delta usually creates a cleaner map. Change one filter at a time so you know why the signal count moved.
Understand the confirmation delay before you write the code
ta.pivotlow() and ta.pivothigh() return a value only after the right-side bars have completed. With rightBars = 5, an RSI low occurring on bar 100 becomes confirmed at the close of bar 105. The script then places its oscillator line and label back on bar 100 with an offset coordinate.
That is not classic repainting. The pivot was unavailable until its confirmation bar arrived; after confirmation, the code stores it and doesn't revise it. TradingView distinguishes this kind of historical-looking pivot display from calculations that can change on realtime updates or after a reload. Its repainting documentation is worth reading alongside our guide to Pine Script repainting.
You still need to trade the alert timing honestly. An alert fires on the confirmation bar, not at the line's left endpoint. If your stop belongs beyond the swing low, calculate it from the known pivot price, but don't pretend you entered at that past candle.
Build the pivot comparison in the right order
The signal sequence is straightforward once the bar alignment is clear:
- Calculate
rsiValuewith an RSI length of 14. - Ask
ta.pivotlow(rsiValue, leftBars, rightBars)andta.pivothigh(...)for confirmed oscillator pivots. - When a pivot confirms, set
pivotBar = bar_index - rightBarsand retrieve the matching price low or high withlow[rightBars]orhigh[rightBars]. - Compare this confirmed pivot to the prior confirmed pivot of the same kind.
- Check the bar distance, RSI delta, and zone filter before creating an event.
- Store the current pivot for the next comparison, whether or not it qualified as a divergence.
That final point prevents a subtle bug. If you save only qualifying pivots, the next comparison may skip a genuine intervening swing and draw a line across an unrelated section of price action. Store every confirmed pivot, then decide whether its pair deserves a label.
The code uses persistent var variables for the previous low and high pivots. Pine retains those values across bars, which makes the state explicit and avoids repeatedly searching through older conditions. Pine's script structure reference covers the bar-by-bar execution model behind this pattern.
Full Pine Script v6 RSI divergence indicator
Paste this into a new TradingView Pine Editor script and add it to an RSI pane. It draws lines in the oscillator pane, labels the four divergence types, limits retained objects, and exposes four alert conditions.
//@version=6
indicator("Confirmed RSI Divergence", shorttitle = "RSI Div", overlay = false, max_lines_count = 300, max_labels_count = 300)

// --- User inputs ---
rsiLength     = input.int(14, "RSI length", minval = 2)
leftBars      = input.int(5, "Pivot left bars", minval = 1)
rightBars     = input.int(5, "Pivot right bars", minval = 1)
minBarsApart  = input.int(5, "Minimum bars between pivots", minval = 1)
maxBarsApart  = input.int(60, "Maximum bars between pivots", minval = 2)
minRsiDelta   = input.float(3.0, "Minimum RSI difference", minval = 0.1, step = 0.1)
bullZone      = input.float(40.0, "Bullish RSI zone maximum", minval = 0.0, maxval = 100.0)
bearZone      = input.float(60.0, "Bearish RSI zone minimum", minval = 0.0, maxval = 100.0)
useZoneFilter = input.bool(true, "Use RSI zone filter")
showHidden    = input.bool(true, "Show hidden divergence")
keepDrawings  = input.int(80, "Maximum lines and labels to retain", minval = 10, maxval = 140)

// --- RSI and confirmed pivots ---
rsiValue = ta.rsi(close, rsiLength)
rsiLowPivot = ta.pivotlow(rsiValue, leftBars, rightBars)
rsiHighPivot = ta.pivothigh(rsiValue, leftBars, rightBars)

plot(rsiValue, "RSI", color = color.new(color.blue, 0), linewidth = 2)
hline(70, "Overbought", color = color.new(color.red, 45), linestyle = hline.style_dashed)
hline(50, "Midline", color = color.new(color.gray, 65))
hline(30, "Oversold", color = color.new(color.lime, 45), linestyle = hline.style_dashed)

// --- Persistent state for the prior confirmed RSI low and high ---
var float previousLowRsi = na
var float previousLowPrice = na
var int previousLowBar = na
var float previousHighRsi = na
var float previousHighPrice = na
var int previousHighBar = na

// Separate object arrays allow controlled cleanup.
var array<line> divergenceLines = array.new_line()
var array<label> divergenceLabels = array.new_label()

bool regularBullish = false
bool hiddenBullish = false
bool regularBearish = false
bool hiddenBearish = false

// --- Compare a newly confirmed RSI low with the preceding RSI low ---
if not na(rsiLowPivot)
    int currentLowBar = bar_index - rightBars
    float currentLowPrice = low[rightBars]
    float currentLowRsi = rsiLowPivot
    bool hasPriorLow = not na(previousLowBar)
    int lowDistance = hasPriorLow ? currentLowBar - previousLowBar : na
    bool lowRangeOk = hasPriorLow and lowDistance >= minBarsApart and lowDistance <= maxBarsApart
    bool lowDeltaOk = hasPriorLow and math.abs(currentLowRsi - previousLowRsi) >= minRsiDelta
    bool bullZoneOk = not useZoneFilter or math.min(currentLowRsi, previousLowRsi) <= bullZone

    regularBullish := lowRangeOk and lowDeltaOk and bullZoneOk and currentLowPrice < previousLowPrice and currentLowRsi > previousLowRsi
    hiddenBullish := lowRangeOk and lowDeltaOk and currentLowPrice > previousLowPrice and currentLowRsi < previousLowRsi

    if regularBullish or (showHidden and hiddenBullish)
        color bullColor = regularBullish ? color.lime : color.aqua
        string bullText = regularBullish ? "Regular Bull" : "Hidden Bull"
        line newBullLine = line.new(previousLowBar, previousLowRsi, currentLowBar, currentLowRsi, xloc = xloc.bar_index, color = bullColor, width = 2)
        label newBullLabel = label.new(currentLowBar, currentLowRsi, bullText, xloc = xloc.bar_index, style = label.style_label_up, color = bullColor, textcolor = color.black, size = size.tiny)
        array.push(divergenceLines, newBullLine)
        array.push(divergenceLabels, newBullLabel)

    previousLowRsi := currentLowRsi
    previousLowPrice := currentLowPrice
    previousLowBar := currentLowBar

// --- Compare a newly confirmed RSI high with the preceding RSI high ---
if not na(rsiHighPivot)
    int currentHighBar = bar_index - rightBars
    float currentHighPrice = high[rightBars]
    float currentHighRsi = rsiHighPivot
    bool hasPriorHigh = not na(previousHighBar)
    int highDistance = hasPriorHigh ? currentHighBar - previousHighBar : na
    bool highRangeOk = hasPriorHigh and highDistance >= minBarsApart and highDistance <= maxBarsApart
    bool highDeltaOk = hasPriorHigh and math.abs(currentHighRsi - previousHighRsi) >= minRsiDelta
    bool bearZoneOk = not useZoneFilter or math.max(currentHighRsi, previousHighRsi) >= bearZone

    regularBearish := highRangeOk and highDeltaOk and bearZoneOk and currentHighPrice > previousHighPrice and currentHighRsi < previousHighRsi
    hiddenBearish := highRangeOk and highDeltaOk and currentHighPrice < previousHighPrice and currentHighRsi > previousHighRsi

    if regularBearish or (showHidden and hiddenBearish)
        color bearColor = regularBearish ? color.red : color.orange
        string bearText = regularBearish ? "Regular Bear" : "Hidden Bear"
        line newBearLine = line.new(previousHighBar, previousHighRsi, currentHighBar, currentHighRsi, xloc = xloc.bar_index, color = bearColor, width = 2)
        label newBearLabel = label.new(currentHighBar, currentHighRsi, bearText, xloc = xloc.bar_index, style = label.style_label_down, color = bearColor, textcolor = color.white, size = size.tiny)
        array.push(divergenceLines, newBearLine)
        array.push(divergenceLabels, newBearLabel)

    previousHighRsi := currentHighRsi
    previousHighPrice := currentHighPrice
    previousHighBar := currentHighBar

// --- Delete oldest objects so long chart histories stay under platform limits ---
if array.size(divergenceLines) > keepDrawings
    line.delete(array.shift(divergenceLines))

if array.size(divergenceLabels) > keepDrawings
    label.delete(array.shift(divergenceLabels))

// Alerts occur on the confirmation bar, not on the historical pivot bar.
alertcondition(regularBullish, "Regular bullish RSI divergence", "Regular bullish RSI divergence confirmed on {{ticker}} at {{close}}")
alertcondition(hiddenBullish and showHidden, "Hidden bullish RSI divergence", "Hidden bullish RSI divergence confirmed on {{ticker}} at {{close}}")
alertcondition(regularBearish, "Regular bearish RSI divergence", "Regular bearish RSI divergence confirmed on {{ticker}} at {{close}}")
alertcondition(hiddenBearish and showHidden, "Hidden bearish RSI divergence", "Hidden bearish RSI divergence confirmed on {{ticker}} at {{close}}")

bgcolor(regularBullish ? color.new(color.lime, 88) : regularBearish ? color.new(color.red, 88) : na, title = "Regular divergence confirmation")
The script stores the two price series separately because price lows are compared only against price lows, and highs only against highs. It also uses math.min() for the bullish zone test and math.max() for the bearish test. That means either endpoint can satisfy the oversold or overbought context requirement.
Lines and labels are objects, not ordinary plots. The array.push() plus array.shift() cleanup pattern deletes the oldest object once the configured limit is exceeded. TradingView documents object IDs and their lifecycle in its objects reference, which matters when you draw on long histories.
Set the filters for the chart, not for every market
Start with the defaults on the timeframe where you make decisions. Then inspect 30 to 50 signals manually before you tighten anything. You are looking for useful swing relationships, not the maximum possible number of labels.
| Trading style | Suggested pivots | Swing range | RSI delta | Zone filter |
|---|---|---|---|---|
| Fast intraday, 1-5 minute | 3 left / 3 right | 4-35 bars | 2.5 | On, 42 / 58 |
| Intraday, 15-60 minute | 5 left / 5 right | 5-60 bars | 3.0 | On, 40 / 60 |
| Swing, 4-hour to daily | 5-8 left / 5-8 right | 8-100 bars | 4.0 | On, 40 / 60 |
A smaller right-bar setting makes signals appear sooner but accepts weaker pivots. A larger setting improves swing quality but delays the alert. There isn't a magic setting because volatility and session structure differ, but there is a disciplined test: keep the entry logic constant, vary one detector input, and review the signal count and follow-through.
For regular divergence, use the zone filter unless you have a defined reason not to. Mid-range regular divergence can work around higher-timeframe structure, but it is usually the first source of clutter. For hidden divergence, the zone filter is not applied in this code because continuation pullbacks often develop away from the extreme RSI bands.
Use divergence as a setup filter, not an automatic entry
Regular bullish divergence says downside momentum weakened while price made a new swing low. It does not say the next candle must rally. Strong trends can produce multiple divergence signals while continuing in the original direction.
Give the event a price-based confirmation. For a bullish regular signal, one practical template is: wait for a close above the nearest minor swing high, enter on the next valid retest or breakout, and place the invalidation below the divergence low. For a bearish signal, invert that sequence.
A simple trend filter improves discipline: only take regular bullish reversals below a falling 50 EMA after price reclaims it, or only take hidden bullish divergence while price remains above a rising 50 EMA. If you want to turn the logic into testable rules, build a VWAP mean-reversion strategy for a useful example of explicit entries, exits, and stops.
Use alert conditions as a prompt to inspect context, not as a command to place an order. TradingView's alert documentation explains how alertcondition() creates selectable alert events. Create the alert after adding the indicator, then choose the specific regular or hidden event from the condition list.
Common RSI divergence coding mistakes
❌ Mistake: treating the pivot offset as an entry signal. A line ending on a candle five bars ago can make the pattern feel immediate.
✅ Do this: act only when the alert fires on the confirmation bar. With rightBars = 5, build your trading rule around the fifth bar after the displayed pivot.
❌ Mistake: using every local wiggle. A 1-left/1-right pivot and no RSI delta filter turns normal noise into a crowded indicator pane.
✅ Do this: begin with 5-left/5-right pivots, 5-to-60 bars between swings, and a 3.0 RSI-point minimum. Reduce those values only if your chosen timeframe produces too few valid structures.
❌ Mistake: comparing the wrong price bar. Using the current bar's low when RSI confirms a prior pivot misaligns price and oscillator by rightBars candles.
✅ Do this: retrieve low[rightBars] and high[rightBars], then set the object x-coordinate to bar_index - rightBars.
❌ Mistake: allowing unlimited drawing objects. A divergence script can create hundreds of lines on a deep chart history.
✅ Do this: keep a line and label array, then delete the oldest item beyond a user-controlled limit such as 80.
❌ Mistake: treating regular divergence as trend reversal proof. In a persistent impulse, several bearish divergences can appear before price finally pulls back.
✅ Do this: require a structure break, moving-average reclaim, or another defined trigger before you model an entry.
Pro tips for making the indicator more useful
Separate detection from execution. Keep this script as an indicator first. It is far easier to audit whether its pivots and labels are correct before wrapping it in strategy.entry() rules.
Use alerts at bar close. The pivot has already required right-side confirmation, so bar-close alerts match the script's intended logic and prevent confusion from intrabar RSI movement.
Add price-pane markers only after validation. The oscillator lines show the divergence cleanly. If you later want chart arrows or a strategy, use the same regularBullish and regularBearish Boolean variables, rather than duplicating comparison logic.
Review failed signals by regime. Tag whether failure happened during a trend expansion, at a range edge, or around a major session transition. That review tells you whether to add a market-structure filter or simply accept that the setup doesn't belong in that regime.
Generating this without writing the code yourself
If you want the same detector but need a different visual style, a price-pane companion marker, or a strategy version, describe the rules precisely in HorizonAI. It can generate and compile-check Pine Script v6 from chat, then you can edit the result in the conversation or its browser editor. It writes the code; you decide how and where to run it in TradingView.
Build a Pine Script v6 indicator named Confirmed RSI Divergence. Calculate RSI length 14. Detect RSI pivot lows and highs using 5 left bars and 5 right bars. Compare each confirmed RSI pivot with the prior same-direction pivot and the matching price low or high at the pivot bar. Plot regular bullish divergence when price makes a lower low and RSI a higher low, and regular bearish divergence when price makes a higher high and RSI a lower high. Also optionally plot hidden bullish and bearish divergence. Reject pairs fewer than 5 or more than 60 bars apart, require at least a 3.0 RSI-point difference, and apply an optional zone filter of RSI below 40 for regular bullish and above 60 for regular bearish. Draw oscillator-pane lines and labels, retain only the most recent 80 line and label objects, and add alertcondition events for all four types. Use confirmed pivots only and explain that alerts occur on the confirmation bar.
For an execution-ready variation, ask it to add a 50 EMA reclaim and fixed stop logic as a separate strategy while preserving the detector's confirmation timing. The generated script can be compile-checked before you copy it into TradingView's Pine Editor.
FAQs
Is RSI divergence reliable?
RSI divergence is a momentum condition, not a standalone prediction. It is most useful when a confirmed divergence aligns with price structure, a defined invalidation level, and a market regime where reversals or pullbacks are plausible.
What timeframe is best for an RSI divergence indicator?
Use the timeframe where you make decisions. Five-left/five-right pivots work well as a starting point on 15-minute through daily charts; lower timeframes usually need smaller pivots and stricter context filters to control noise.
Why does my RSI divergence line appear late?
The line is drawn back at the pivot candle, but the pivot cannot be confirmed until the configured right-side bars close. With five right bars, the alert occurs five candles after the displayed turning point.
What is the difference between hidden and regular RSI divergence?
Regular divergence compares a new price extreme with weaker momentum and is commonly used to watch for reversals. Hidden divergence compares a higher low or lower high in price with the opposite RSI swing and is commonly used to find trend-continuation pullbacks.
Final thoughts
A good RSI divergence indicator is conservative by design. Confirm its pivots, align price and RSI on the same historical bars, reject weak or stale pairs, and treat the result as a context filter rather than a blind entry.
The most useful improvement is usually not another oscillator. Test one confirmation rule, such as a break of the nearest swing level, against the exact confirmation-bar timing used by the script.
Related articles
- RSI vs MACD: which indicator is better? — Compare two common momentum tools before combining them.
- Pine Script repainting: why it happens and how to fix it — Separate pivot confirmation delay from genuine repainting problems.
- Build a WaveTrend oscillator in Pine Script v6 — Code another momentum oscillator with clear visual signals.
- Build a Squeeze Momentum indicator in Pine Script v6 — Add volatility context to momentum analysis.
- How to code a combined RSI + MACD indicator — Build a two-indicator momentum dashboard.
- Build a VWAP mean-reversion strategy in Pine Script v6 — Turn a mean-reversion idea into explicit entry and exit rules.
- How to backtest a trading strategy — Validate a confirmation rule before relying on it.
- Backtesting mistakes to avoid — Avoid lookahead bias and other testing traps.
Questions about RSI divergence indicators? Join our Discord to discuss with other traders!