
Build an Opening Range Breakout Indicator in NinjaScript
By HorizonAI Team · 12 min read · Intermediate
Build an Opening Range Breakout Indicator in NinjaScript
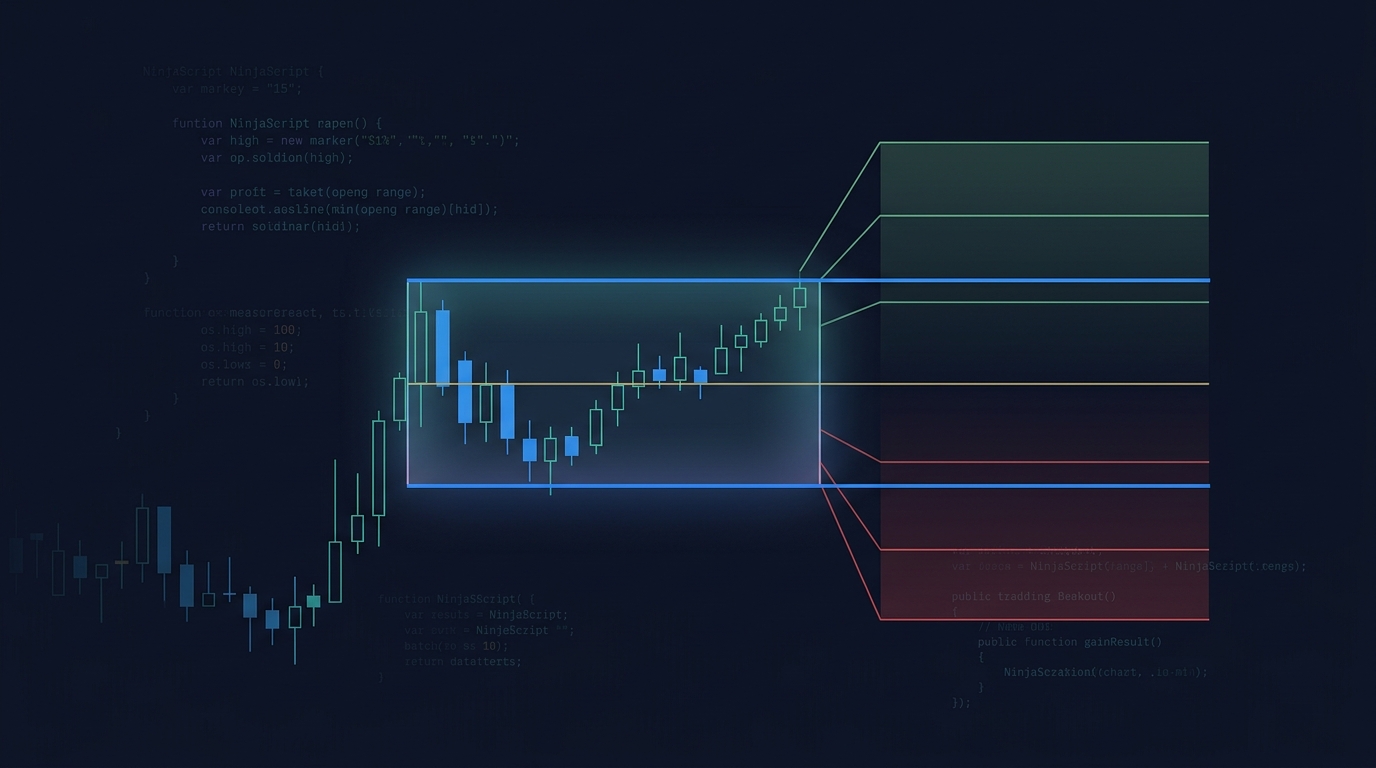
The first 5, 15, or 30 minutes of a futures session often become a reference range for the rest of the day. Marking that range by hand is slow, inconsistent, and easy to get wrong when you switch instruments or trading-hours templates. A session-aware NinjaTrader 8 indicator fixes that by recording the early high and low once, then carrying the levels forward automatically.
Short answer: build an opening-range breakout (ORB) indicator by using OnStateChange() to define plots and inputs, then using OnBarUpdate() to reset at each session, collect highs and lows for a timed window, and plot the locked range plus extensions. The NinjaScript below supports a configurable start time, 5/15/30-minute range, optional RTH time filter, two extension levels, and one alert per directional break.
The important detail is that an ORB is a charting tool, not a trading system. It shows the opening-range high, low, midpoint, and measured extensions. You can read those public output series from a separate strategy, add your own entry filters, and test the complete ruleset before risking anything.
Set up the chart before you add code
An opening range only means something relative to a defined session. On US index futures, many traders want a range beginning at 09:30 Eastern Time. On a chart using a CME ETH template, that time may sit inside a much longer overnight session. On a chart using an RTH template, it may be the session open. Those are different choices, so the indicator makes the time window explicit instead of guessing.
Use an intraday data series whose bars are no larger than the range you want to measure. A 5-minute ORB on a 5-minute chart is workable, but a 1-minute chart gives the cleanest opening high and low. A 15-minute range can be calculated on 1-, 3-, 5-, or 15-minute bars, although a 1-minute series captures the actual extremes more precisely.
Before importing the script:
- Open NinjaTrader 8 Control Center > New > NinjaScript Editor.
- Right-click Indicators, choose New Indicator, and name it
OpeningRangeBreakout. - Replace the generated class with the complete code below, then compile.
- Add it to an intraday chart. Start with
OpeningRangeStartTime = 93000andOpeningRangeMinutes = 15for a US cash-session opening range. - Match
RegularSessionStartTimeandRegularSessionEndTimeto the session you actually intend to study whenUseRthWindowis enabled.
NinjaTrader indicators declare their plots with AddPlot() and update them bar by bar in OnBarUpdate(). Those lifecycle hooks are the documented pattern for custom indicators. See NinjaTrader's references for AddPlot, OnStateChange, and OnBarUpdate.
Session check: set the chart's Trading hours template first, then set the indicator inputs. A 09:30 start time is interpreted in the timestamp/time-zone context of the chart and its data, not as a universal market clock.
The full NinjaScript opening-range indicator
Paste this as one complete indicator. It creates seven plots: opening-range high, low, midpoint, first upper/lower extension, and second upper/lower extension. It only finalizes the plots after the opening window ends, preventing the chart from treating a still-forming range as complete.
#region Using declarations
using System;
using System.ComponentModel;
using System.ComponentModel.DataAnnotations;
using System.Windows.Media;
using System.Xml.Serialization;
using NinjaTrader.NinjaScript;
using NinjaTrader.NinjaScript.DrawingTools;
using NinjaTrader.NinjaScript.Indicators;
#endregion

namespace NinjaTrader.NinjaScript.Indicators
{
    public class OpeningRangeBreakout : Indicator
    {
        private double openingHigh;
        private double openingLow;
        private DateTime openingRangeEnd;
        private bool rangeStarted;
        private bool rangeLocked;
        private bool upperBreakAlerted;
        private bool lowerBreakAlerted;

        [NinjaScriptProperty]
        [Range(0, 235959)]
        [Display(Name = "Opening Range Start Time", GroupName = "Parameters", Order = 0)]
        public int OpeningRangeStartTime { get; set; }

        [NinjaScriptProperty]
        [Range(1, 180)]
        [Display(Name = "Opening Range Minutes", GroupName = "Parameters", Order = 1)]
        public int OpeningRangeMinutes { get; set; }

        [NinjaScriptProperty]
        [Display(Name = "Use RTH Window", GroupName = "Parameters", Order = 2)]
        public bool UseRthWindow { get; set; }

        [NinjaScriptProperty]
        [Range(0, 235959)]
        [Display(Name = "Regular Session Start Time", GroupName = "Parameters", Order = 3)]
        public int RegularSessionStartTime { get; set; }

        [NinjaScriptProperty]
        [Range(0, 235959)]
        [Display(Name = "Regular Session End Time", GroupName = "Parameters", Order = 4)]
        public int RegularSessionEndTime { get; set; }

        [NinjaScriptProperty]
        [Range(0.1, 10.0)]
        [Display(Name = "Extension 1 Multiplier", GroupName = "Extensions", Order = 5)]
        public double Extension1Multiplier { get; set; }

        [NinjaScriptProperty]
        [Range(0.1, 10.0)]
        [Display(Name = "Extension 2 Multiplier", GroupName = "Extensions", Order = 6)]
        public double Extension2Multiplier { get; set; }

        [NinjaScriptProperty]
        [Display(Name = "Enable Breakout Alerts", GroupName = "Alerts", Order = 7)]
        public bool EnableBreakoutAlerts { get; set; }

        [Browsable(false)]
        [XmlIgnore]
        public Series<double> OpeningRangeHigh { get { return Values[0]; } }

        [Browsable(false)]
        [XmlIgnore]
        public Series<double> OpeningRangeLow { get { return Values[1]; } }

        [Browsable(false)]
        [XmlIgnore]
        public Series<double> OpeningRangeMidpoint { get { return Values[2]; } }

        [Browsable(false)]
        [XmlIgnore]
        public Series<double> UpperExtension1 { get { return Values[3]; } }

        [Browsable(false)]
        [XmlIgnore]
        public Series<double> LowerExtension1 { get { return Values[4]; } }

        [Browsable(false)]
        [XmlIgnore]
        public Series<double> UpperExtension2 { get { return Values[5]; } }

        [Browsable(false)]
        [XmlIgnore]
        public Series<double> LowerExtension2 { get { return Values[6]; } }

        protected override void OnStateChange()
        {
            if (State == State.SetDefaults)
            {
                Description = "Plots a timed opening range, midpoint, extensions, and first breakout alerts.";
                Name = "OpeningRangeBreakout";
                Calculate = Calculate.OnBarClose;
                IsOverlay = true;
                DisplayInDataBox = true;
                DrawOnPricePanel = true;
                IsSuspendedWhileInactive = true;

                OpeningRangeStartTime = 93000;
                OpeningRangeMinutes = 15;
                UseRthWindow = true;
                RegularSessionStartTime = 93000;
                RegularSessionEndTime = 160000;
                Extension1Multiplier = 1.0;
                Extension2Multiplier = 2.0;
                EnableBreakoutAlerts = true;

                AddPlot(Brushes.DodgerBlue, "OR High");
                AddPlot(Brushes.DodgerBlue, "OR Low");
                AddPlot(Brushes.Goldenrod, "OR Midpoint");
                AddPlot(Brushes.ForestGreen, "Upper Extension 1");
                AddPlot(Brushes.IndianRed, "Lower Extension 1");
                AddPlot(Brushes.LimeGreen, "Upper Extension 2");
                AddPlot(Brushes.OrangeRed, "Lower Extension 2");
            }
        }

        protected override void OnBarUpdate()
        {
            if (CurrentBar < 1)
                return;

            if (Bars.IsFirstBarOfSession)
                ResetOpeningRange();

            int currentTime = ToTime(Time[0]);

            if (UseRthWindow && !IsWithinTimeWindow(currentTime, RegularSessionStartTime, RegularSessionEndTime))
            {
                ClearPlots();
                return;
            }

            if (!rangeStarted && IsAtOrAfter(currentTime, OpeningRangeStartTime))
            {
                rangeStarted = true;
                openingHigh = High[0];
                openingLow = Low[0];
                openingRangeEnd = Time[0].AddMinutes(OpeningRangeMinutes);
            }

            if (rangeStarted && !rangeLocked)
            {
                if (Time[0] < openingRangeEnd)
                {
                    openingHigh = Math.Max(openingHigh, High[0]);
                    openingLow = Math.Min(openingLow, Low[0]);
                    ClearPlots();
                    return;
                }

                rangeLocked = true;
            }

            if (!rangeLocked)
            {
                ClearPlots();
                return;
            }

            double range = openingHigh - openingLow;
            double midpoint = (openingHigh + openingLow) * 0.5;

            OpeningRangeHigh[0] = openingHigh;
            OpeningRangeLow[0] = openingLow;
            OpeningRangeMidpoint[0] = midpoint;
            UpperExtension1[0] = openingHigh + range * Extension1Multiplier;
            LowerExtension1[0] = openingLow - range * Extension1Multiplier;
            UpperExtension2[0] = openingHigh + range * Extension2Multiplier;
            LowerExtension2[0] = openingLow - range * Extension2Multiplier;

            if (!EnableBreakoutAlerts)
                return;

            if (!upperBreakAlerted && Close[0] > openingHigh && Close[1] <= openingHigh)
            {
                upperBreakAlerted = true;
                Draw.ArrowUp(this, "ORBUp" + CurrentBar, false, 0, Low[0] - 2 * TickSize, Brushes.LimeGreen);
                Alert("ORBUp" + CurrentBar, Priority.High, "Opening range high broken", "Alert1.wav", 10, Brushes.Black, Brushes.White);
            }

            if (!lowerBreakAlerted && Close[0] < openingLow && Close[1] >= openingLow)
            {
                lowerBreakAlerted = true;
                Draw.ArrowDown(this, "ORBDown" + CurrentBar, false, 0, High[0] + 2 * TickSize, Brushes.OrangeRed);
                Alert("ORBDown" + CurrentBar, Priority.High, "Opening range low broken", "Alert1.wav", 10, Brushes.Black, Brushes.White);
            }
        }

        private void ResetOpeningRange()
        {
            openingHigh = double.MinValue;
            openingLow = double.MaxValue;
            openingRangeEnd = Core.Globals.MinDate;
            rangeStarted = false;
            rangeLocked = false;
            upperBreakAlerted = false;
            lowerBreakAlerted = false;
        }

        private void ClearPlots()
        {
            for (int plotIndex = 0; plotIndex < Values.Length; plotIndex++)
                Values[plotIndex][0] = double.NaN;
        }

        private bool IsAtOrAfter(int currentTime, int startTime)
        {
            return currentTime >= startTime;
        }

        private bool IsWithinTimeWindow(int currentTime, int startTime, int endTime)
        {
            if (startTime <= endTime)
                return currentTime >= startTime && currentTime <= endTime;

            return currentTime >= startTime || currentTime <= endTime;
        }
    }
}
The plot setup follows NinjaTrader's supported AddPlot() approach. The public Series<double> properties are named handles for the underlying Values[] plots, which lets a strategy access the range without copying the calculation.
How the session and range logic works
The indicator has three states each session: waiting, measuring, and locked.
Waiting: At the first bar of the chart session, Bars.IsFirstBarOfSession clears the previous range and alert flags. The script waits until OpeningRangeStartTime. If you use a 09:30 US equity-session start, enter 93000, which is NinjaTrader's HHmmss integer format.
Measuring: The first eligible bar seeds openingHigh and openingLow, then openingRangeEnd is set to the timestamp plus OpeningRangeMinutes. Every subsequent bar before that endpoint updates the high and low. The plots are deliberately NaN while this is happening, so you don't mistake a provisional high for the final range boundary.
Locked: Once a bar timestamp reaches the end time, the script freezes the range and publishes seven values on every bar. The midpoint is (high + low) / 2. A 1.0 extension is one whole opening-range height above the high or below the low. A 2.0 extension is two range heights away.
For example, if the 15-minute NQ opening range is 20,000.00 to 20,040.00, its size is 40 points. The midpoint is 20,020.00. With the default multipliers, upper extension one is 20,080.00 and lower extension one is 19,960.00. That arithmetic gives you a stable map of the day; it doesn't tell you which side will break.
The RTH switch is a filter, not a detector of a market's official regular session. With UseRthWindow = true, bars outside the RegularSessionStartTime to RegularSessionEndTime window are hidden. For a session that crosses midnight, the helper supports a start time later than the end time. Your chart template still controls which bars NinjaTrader supplies and where Bars.IsFirstBarOfSession occurs.
Choose inputs that match the instrument
Start with one of these configurations rather than changing every input at once.
| Market use case | Opening start | Range minutes | RTH window | Extensions |
|---|---|---|---|---|
| US stocks or index futures cash open | 93000 | 15 | 09:30 to 16:00 | 1.0 and 2.0 |
| Faster index-futures reference | 93000 | 5 | 09:30 to 16:00 | 1.0 and 1.5 |
| Slower first-hour structure | 93000 | 30 | 09:30 to 16:00 | 1.0 and 2.0 |
| London-session study | local chart time | 15 | your London session window | 1.0 and 2.0 |
A 5-minute range responds quickly but can be narrow and noisy. A 30-minute range needs more patience and is usually wider. Neither setting is universally better, because the range is only one component of an entry plan.
Keep the extension multipliers simple at first. A 1.0 target defines a measured move equal to the range. A 2.0 line is a second reference, not an instruction to hold a position until that level. If you later turn this into a strategy, pair the range break with an invalidation rule such as a close back inside the range, a fixed tick stop, or a volatility-based stop. The mechanics of turning chart logic into an order-capable script are covered in our first NinjaTrader 8 strategy tutorial.
Add breakout arrows and alerts without duplicate signals
A line break alone can fire repeatedly if price hovers around the boundary. This script uses two guards:
Close[0] > openingHigh && Close[1] <= openingHighdetects a close crossing from at or below the high to above it.upperBreakAlertedprevents a second upper alert during the same session. The lower side uses the mirrored condition and flag.
The arrow and alert happen only after the range is locked. That avoids a common logical bug where price appears to break an opening high that is still being updated by a later bar inside the opening window.
The default is Calculate.OnBarClose. That means a breakout is confirmed only when the bar closes beyond the level. It produces fewer intrabar flickers and aligns naturally with the script's Close[0] crossing test. NinjaTrader also supports Calculate.OnEachTick, documented in its Calculate reference, but changing it doesn't automatically make a close-based condition intrabar.
If you need a first-touch alert instead, change the upper condition to High[0] > openingHigh && High[1] <= openingHigh, and use the analogous low test. That is a different event: it alerts on a wick through the level, not a closing break. Keep that distinction visible in the alert text so you can tell later which event you configured.
Practical default: keep
Calculate.OnBarCloseand alerts enabled while validating the indicator. Move to tick processing only when you have a specific first-touch rule and understand that historical and real-time update timing can differ.
Read the ORB values from a NinjaScript strategy
The public plot properties make the indicator reusable. A strategy can instantiate OpeningRangeBreakout with the same inputs and read orb.OpeningRangeHigh[0], orb.OpeningRangeLow[0], or any extension series after the range locks. Test for double.IsNaN(orb.OpeningRangeHigh[0]) first, because the indicator intentionally hides its values while the range is still forming.
A simple close-break condition is Close[0] > orb.OpeningRangeHigh[0] && Close[1] <= orb.OpeningRangeHigh[1]. That is a signal only, not a complete trade plan. Add position-state checks, exits, a stop-loss, and a testable time cutoff before treating it as a strategy. If your ORB reference belongs on a higher timeframe while execution occurs on a lower timeframe, use the multi-series pattern in this NinjaScript multi-timeframe guide.
A useful next design is to make the entry rule stricter than “first close outside.” For example: require a 15-minute range, a close above the high, and a retest that holds the high within the next six 1-minute bars. That converts the ORB from a visual reference into an explicit, testable hypothesis. It also avoids silently assuming every break deserves an entry.
Common ORB indicator mistakes and the fixes
❌ Mistake: treating 09:30 as the correct open on every chart. A futures chart can use an ETH template, an RTH template, or an exchange-specific custom template. The indicator may be working exactly as written while its time inputs describe the wrong market window.
✅ Do this: inspect the chart's Trading hours setting, then set OpeningRangeStartTime, RegularSessionStartTime, and RegularSessionEndTime to that same convention. For a US cash-open study, start with 93000, 93000, and 160000.
❌ Mistake: using a 15-minute ORB on 30-minute bars. The first 30-minute bar contains the range, but it also includes 15 minutes that don't belong in it. The reported high and low become overstated.
✅ Do this: use a primary series equal to or smaller than the opening range. For a 15-minute ORB, 1- or 5-minute bars are sensible; for a 5-minute ORB, use 1-minute bars.
❌ Mistake: alerting while the opening range is still forming. A provisional high can be exceeded and then replaced by a higher value before the range ends. The apparent breakout wasn't a break of the final range.
✅ Do this: wait for rangeLocked before checking a cross. The complete script does this by returning early until the timed window has ended.
❌ Mistake: expecting OnEachTick to repair a close-confirmation rule. Tick calculation makes OnBarUpdate() run more frequently, but Close[0] still represents the current developing bar's last price in real time.
✅ Do this: decide whether you want a close break, a high/low touch, or a bid/ask-based event. Code that event explicitly, then test it in the same calculation mode you plan to use.
❌ Mistake: moving the indicator to a strategy and calling it “automated trading.” The indicator and a NinjaTrader strategy are separate artifacts. Entry code only defines orders inside NinjaTrader's strategy engine; it doesn't prove the entry, exit, or risk logic is complete.
✅ Do this: build the indicator first, then define every rule around it: entry confirmation, initial stop, target or exit condition, daily time cutoff, and position sizing. Review backtesting metrics before judging the result from a handful of sessions.
Pro tips for a cleaner session tool
Use the midpoint as a filter, not decoration. After the range locks, the midpoint separates the upper and lower halves of that morning's balance. If you later test pullback entries, record whether they held above or below that midpoint instead of treating every retest identically.
Make the alert labels unique. The code includes CurrentBar in each arrow and alert tag. That keeps a new session's first break from colliding with an old drawing object that happens to have the same static name.
Keep the range and execution timeframes separate when necessary. A 15-minute opening range calculated on one-minute data can feed entries on a one-minute chart, while a 15-minute chart can be used only for context. The Pine-to-NinjaScript conversion guide is useful if you're translating an existing TradingView ORB design, but re-check session and indexing behavior rather than doing a literal line-by-line port.
Save screenshots with the input values visible. ORB results change materially with start time, range duration, bar size, and trading-hours template. A chart image without those four settings is difficult to reproduce later.
Generating this without writing the code yourself
HorizonAI can generate a NinjaScript version of this indicator from a plain-English specification, then compile-check it and let you revise the result in chat. It writes code for NinjaTrader; it doesn't place trades or connect to a broker.
Create a NinjaTrader 8 NinjaScript indicator named OpeningRangeBreakout. Overlay it on price. Reset at each chart session, start measuring at 09:30:00 chart time, and measure the first 15 minutes. Plot the locked opening-range high and low in blue, midpoint in gold, plus 1.0x and 2.0x range extensions above and below. Add inputs for opening start HHmmss, range minutes, RTH start/end filter, extension multipliers, and enable alerts. After the range locks, draw one green up arrow and alert on the first bar close above the high, and one red down arrow and alert on the first bar close below the low. Expose public Series
outputs for all levels and use Calculate.OnBarClose.
You can then ask for a focused change, such as: “Add a six-bar retest confirmation after the breakout, but keep the indicator visual-only.” HorizonAI returns editable NinjaScript code and compiler feedback, while the actual charting and any strategy execution remain in your own NinjaTrader setup.
FAQs
What is the best opening-range length for an ORB indicator?
Five, 15, and 30 minutes are practical starting points. Use the shortest bar series that can measure your chosen window accurately, then compare the same fixed settings across enough sessions before changing them.
Why are my ORB lines missing after I add the indicator?
The lines stay hidden until the opening window has fully elapsed. Check that the chart contains bars at your configured start time and that the RTH start/end inputs include that time.
Can this indicator trade an opening-range breakout automatically?
No. This is an indicator that plots levels and can issue NinjaTrader alerts. A separate strategy needs explicit entries, exits, position rules, and testing before it can submit simulated or live orders inside NinjaTrader.
Should I use OnBarClose or OnEachTick for ORB alerts?
Use OnBarClose for a close-confirmed break and easier review. Use OnEachTick only when your rule is deliberately based on intrabar touches or developing prices, then test that exact behavior.
Final thoughts
A useful ORB indicator does one job precisely: it defines the same early-session range every day and leaves the interpretation to rules you can state and test. Start with a 15-minute range on one-minute data, lock it before evaluating breaks, and write down the chart template and time inputs beside every result.
Related articles
- NinjaScript Tutorial: Code Your First NinjaTrader 8 Strategy — Turn an indicator signal into a structured NinjaTrader strategy.
- How to Build a Multi-Timeframe Strategy in NinjaScript — Use separate context and execution series without indexing errors.
- How to Convert Pine Script to NinjaScript for NinjaTrader 8 — Translate TradingView logic while accounting for platform differences.
- How to Backtest a Trading Strategy — Build a repeatable test process around explicit rules.
- Understanding Backtesting Metrics — Read drawdown, profit factor, and related results correctly.
- How to Backtest Trading Strategies Like a Pro — Avoid the data and execution assumptions that distort tests.
- ATR Indicator Explained — Add volatility context when defining stops or filters.
- Break and Retest Strategy — The Complete Trading Guide — Develop a retest rule around a confirmed range break.
Questions about opening-range breakout indicators? Join our Discord to discuss with other traders!