
Create a Custom NinjaTrader 8 Indicator With NinjaScript
By HorizonAI Team · 12 min read · Beginner
How to Create a Custom Indicator in NinjaTrader 8 with NinjaScript
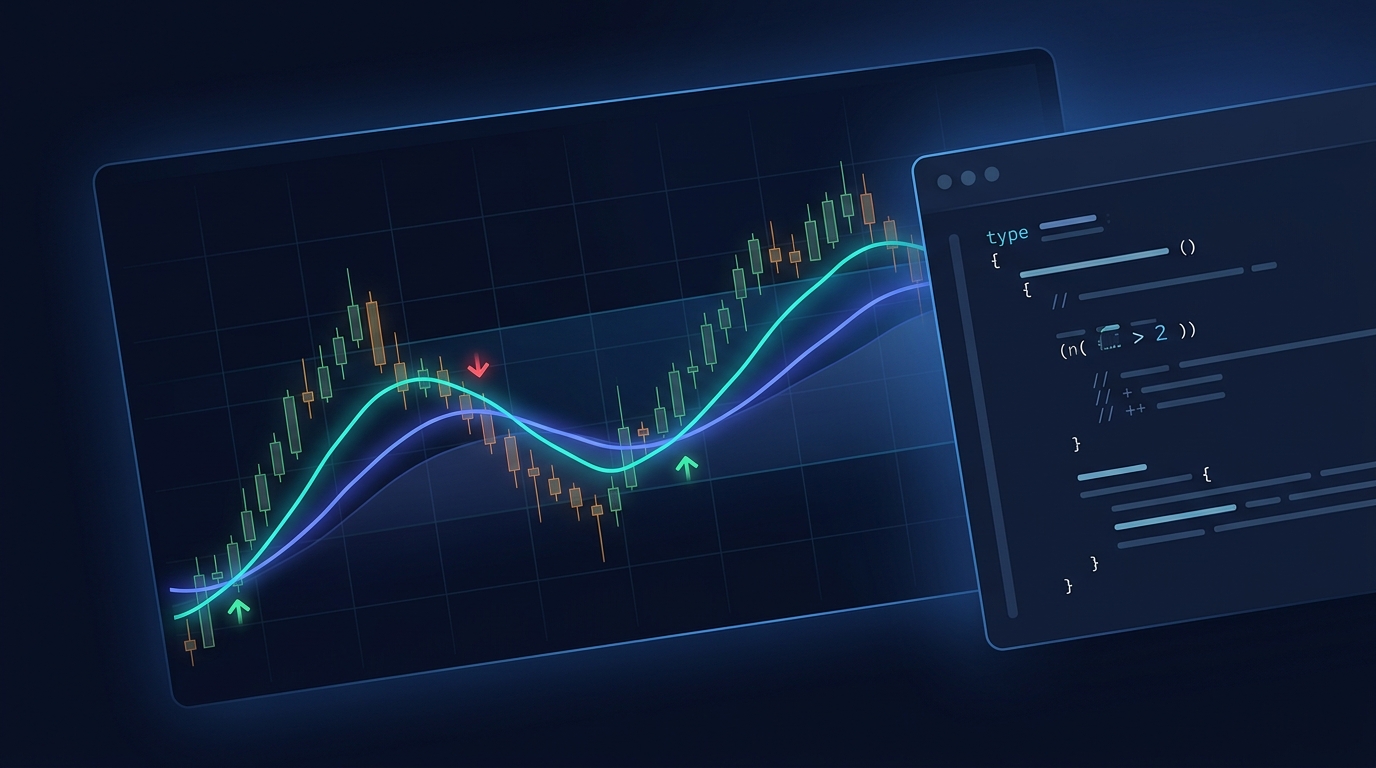
A useful first NinjaTrader indicator should make one decision visible, not try to trade for you. Here, you’ll build an overlay that plots a fast and slow EMA, marks confirmed crossovers with arrows, and can color the averages by trend direction.
Short answer: Create an NT8 indicator from the NinjaScript Editor, set defaults and plots in OnStateChange(), instantiate the two EMA series when data loads, then update plots and draw crossover arrows in OnBarUpdate(). Keep it as an indicator when it only visualizes a condition; a strategy adds order methods and is a different script type.
The finished indicator uses a 9-period EMA and a 21-period EMA by default. It waits until the slow EMA has enough bars, plots both lines on the price panel, draws one arrow on each confirmed crossover, and exposes every useful setting in the indicator panel. Start with that small, testable artifact before adding filters, multi-timeframe logic, or orders.
What you are building, and why it is an indicator
The artifact is EMA Crossover Signals: two configurable exponential moving averages, a green arrow when the fast average crosses above the slow average, and a red arrow when it crosses below. It also offers a trend-color switch: blue and orange in neutral mode, green/red when the fast EMA is above/below the slow EMA.
That makes it an indicator. It reads bar data and draws information on a chart. It does not submit entries, define a stop loss, manage a position, or produce a performance report. If you want the order-handling version later, use the first NinjaTrader 8 strategy tutorial as the next step.
For a first build, use the defaults below:
| Setting | Default | Why it is here |
|---|---|---|
| Fast EMA | 9 bars | Responds quickly to recent price movement |
| Slow EMA | 21 bars | Supplies a slower comparison baseline |
| Calculate | On bar close | Prevents a still-forming bar from repeatedly changing the crossover state |
| Arrow offset | 2 ticks | Keeps arrows from covering the candle high or low |
| Trend colors | On | Makes the current EMA relationship readable at a glance |
The 9/21 pair is a visualization starting point, not a universal setup. On a 5-minute futures chart it will react far more often than it does on an hourly stock chart. Build the tool first, then adjust periods for the market and timeframe you actually review.
Create the indicator shell in NinjaTrader 8
Open New > NinjaScript Editor in NinjaTrader 8. In the editor, right-click the Indicators folder, choose New Indicator, name it EmaCrossoverSignals, and finish the wizard. NinjaTrader creates the class in the correct NinjaTrader.NinjaScript.Indicators namespace and opens it for editing.
The filename and public class name must match: EmaCrossoverSignals.cs contains public class EmaCrossoverSignals. A mismatch is a common reason that a script compiles poorly or doesn’t appear where you expect it in the indicator list.
Replace the generated class contents with the code below, retaining the standard using declarations. This is a whole indicator, not a fragment. Paste it into the editor, press F5 to compile, then add it from a chart’s Indicators dialog.
#region Using declarations
using System;
using System.ComponentModel;
using System.ComponentModel.DataAnnotations;
using System.Windows.Media;
using NinjaTrader.Gui.Chart;
using NinjaTrader.Gui.Tools;
using NinjaTrader.NinjaScript;
using NinjaTrader.NinjaScript.DrawingTools;
using NinjaTrader.NinjaScript.Indicators;
#endregion

namespace NinjaTrader.NinjaScript.Indicators
{
    public class EmaCrossoverSignals : Indicator
    {
        private EMA fastEma;
        private EMA slowEma;

        [NinjaScriptProperty]
        [Range(1, int.MaxValue)]
        [Display(Name = "Fast EMA period", GroupName = "Parameters", Order = 0)]
        public int FastPeriod { get; set; }

        [NinjaScriptProperty]
        [Range(2, int.MaxValue)]
        [Display(Name = "Slow EMA period", GroupName = "Parameters", Order = 1)]
        public int SlowPeriod { get; set; }

        [NinjaScriptProperty]
        [Display(Name = "Color plots by trend", GroupName = "Display", Order = 2)]
        public bool ColorPlotsByTrend { get; set; }

        protected override void OnStateChange()
        {
            if (State == State.SetDefaults)
            {
                Description              = "Plots two EMAs and marks confirmed crossover signals.";
                Name                     = "EMA Crossover Signals";
                Calculate                = Calculate.OnBarClose;
                IsOverlay                = true;
                DisplayInDataBox         = true;
                DrawOnPricePanel         = true;
                PaintPriceMarkers        = true;
                IsSuspendedWhileInactive = true;

                FastPeriod        = 9;
                SlowPeriod        = 21;
                ColorPlotsByTrend = true;

                AddPlot(Brushes.DodgerBlue, "Fast EMA");
                AddPlot(Brushes.DarkOrange, "Slow EMA");
            }
            else if (State == State.DataLoaded)
            {
                fastEma = EMA(FastPeriod);
                slowEma = EMA(SlowPeriod);
            }
        }

        protected override void OnBarUpdate()
        {
            if (CurrentBar < SlowPeriod)
                return;

            Values[0][0] = fastEma[0];
            Values[1][0] = slowEma[0];

            if (ColorPlotsByTrend)
            {
                Brush trendBrush = fastEma[0] >= slowEma[0] ? Brushes.LimeGreen : Brushes.Red;
                PlotBrushes[0][0] = trendBrush;
                PlotBrushes[1][0] = trendBrush;
            }

            if (CrossAbove(fastEma, slowEma, 1))
            {
                Draw.ArrowUp(this, "BullishCross" + CurrentBar, false, 0,
                    Low[0] - 2 * TickSize, Brushes.LimeGreen);
            }
            else if (CrossBelow(fastEma, slowEma, 1))
            {
                Draw.ArrowDown(this, "BearishCross" + CurrentBar, false, 0,
                    High[0] + 2 * TickSize, Brushes.Red);
            }
        }
    }
}
Understand the four pieces that make the code work
A NinjaScript indicator has a lifecycle. The code is easier to modify when you separate setup from bar-by-bar calculation instead of placing everything in one method.
OnStateChange() sets defaults and prepares resources
OnStateChange() runs through named states while NinjaTrader initializes the script. State.SetDefaults is the place for display metadata, default user inputs, calculation behavior, and plot definitions. State.DataLoaded is where this indicator creates its two built-in EMA objects. NinjaTrader documents this state-driven setup because different operations are valid at different points in the lifecycle. See the OnStateChange() reference.
AddPlot() belongs in the defaults state. Each call creates a plotted output series, and the order matters: AddPlot(... "Fast EMA") becomes Values[0], while the slow line becomes Values[1]. The API reference also notes that plots are configured during State.SetDefaults or State.Configure, not dynamically from OnBarUpdate(). Read the AddPlot() documentation.
Input properties turn hard-coded values into controls
[NinjaScriptProperty] tells NinjaTrader to show a property in the indicator settings. Range prevents nonsensical periods such as zero, and Display gives users readable labels and groups.
Notice that the fast and slow periods are independent inputs. The code doesn’t force FastPeriod < SlowPeriod. You can add that guard later, but keeping the first version simple helps you see exactly what each setting changes. Before trusting a configuration, check it yourself: a 50-fast/21-slow input still compiles, but it reverses the usual role of the lines.
OnBarUpdate() runs the chart logic
OnBarUpdate() is called as NinjaTrader processes data for the indicator. The method first returns until there are enough bars for the slow period, then assigns the latest EMA values to its plot series. NinjaTrader’s reference describes it as the central calculation event and stresses guarding against insufficient historical bars before accessing bar-indexed values. Review OnBarUpdate().
Values[0][0] means the latest value of the first plot. The first [0] selects the Fast EMA plot. The second [0] selects the current bar. That two-index pattern feels strange at first, but it’s the key distinction between a plot series and a single numeric value.
Crossover detection needs a one-bar lookback
CrossAbove(fastEma, slowEma, 1) returns true when the fast EMA crosses from below to above the slow EMA within a one-bar lookback. The matching CrossBelow call handles the opposite event. The unique drawing tag, such as BullishCross125, includes CurrentBar so every historical crossover gets its own arrow rather than replacing an earlier arrow.
The indicator uses Calculate.OnBarClose. That means the crossover arrow is evaluated once when the bar closes. Calculate.OnEachTick updates during an open bar and can be appropriate for intrabar visualization, but it can show a temporary crossover that disappears before close. NinjaTrader’s calculation-mode reference explains that the setting controls when OnBarUpdate() processes incoming data. Compare the available Calculate modes.
Build choice: Start with
OnBarClose. Change toOnEachTickonly when you deliberately want intrabar behavior and understand that a live bar can move back through both EMAs.
Compile it and add it to a chart
Press F5 in the NinjaScript Editor. If the compile succeeds, open a chart, right-click it, choose Indicators, find EMA Crossover Signals, and click Add. Set Fast EMA period to 9, Slow EMA period to 21, leave trend colors on, and apply.
Test it in three passes:
- Visual pass: confirm that both lines follow the built-in EMA indicators with the same periods.
- Signal pass: scroll to an obvious crossover and confirm there is one arrow on the crossover bar, not one on every bar of the trend.
- Input pass: change the periods to 20 and 50. The lines and arrows should update without editing code.
If you see no arrows, zoom out and inspect a section where the averages genuinely cross. If you see arrows but disagree with the exact bar, check whether you expected an intrabar cross. This version intentionally waits for the completed bar.
To create alert-ready conditions, you don’t need to turn the indicator into a strategy. In NinjaTrader’s Alerts window, build a condition around the indicator’s displayed plots or values. Treat the arrow as visual confirmation and the underlying EMA relationship as the condition you test.
Make the colors communicate state, not just decoration
The ColorPlotsByTrend option sets both plots green when fast EMA is at or above slow EMA, and red when it is below. That makes trend state obvious, but it removes the fixed blue/orange identity of each average.
Use the toggle based on how you read charts:
- Trend-state reading: leave it on. You care most about whether fast is above or below slow.
- Line-identity reading: turn it off. You care which individual average is reacting first.
- Signal-only reading: keep fixed colors and use the arrows as the decision markers.
A useful next modification is a third input called ShowArrows. Wrap the two Draw calls in if (ShowArrows) so you can study the EMAs without signals. Make that change only after the base version works, because each added option expands the testing surface.
For a broader explanation of why moving-average choice changes responsiveness, read EMA vs. SMA. If you later want to pair the crossover with a momentum confirmation, the combined RSI and MACD indicator guide shows how to keep multiple conditions explicit rather than implied.
Common mistakes that stop a first custom indicator
❌ Mistake: Adding plots inside OnBarUpdate(). That method runs repeatedly, so plots must be declared once during setup. Repeatedly defining chart resources leads to errors or unpredictable behavior.
✅ Do this: Put AddPlot in State.SetDefaults, then write values to Values[0][0] and Values[1][0] in OnBarUpdate().
❌ Mistake: Accessing the slow EMA before enough bars exist. A 21-period EMA needs history before its output is meaningful, and series indexing becomes unsafe when the script asks for bars that aren’t there.
✅ Do this: Keep the if (CurrentBar < SlowPeriod) return; guard at the top of OnBarUpdate(). If you add a 50-period filter, change the guard to the largest period you use.
❌ Mistake: Naming the file and class differently. For example, creating MyEmaSignal.cs while the public class remains EmaCrossoverSignals makes scripts harder to locate and can create namespace confusion.
✅ Do this: Create the script with the final name in the NinjaScript Editor, then keep the file name, public class name, and indicator list name aligned.
❌ Mistake: Expecting an indicator to place an order. Arrows and alert conditions are chart output. They don’t call EnterLong(), EnterShort(), or manage a position.
✅ Do this: Keep visual logic in the indicator. When you are ready to define orders, stops, and targets, move the conditions into a strategy and test the order behavior separately.
❌ Mistake: Using Calculate.OnEachTick just because it feels faster. It can print a crossover during the open bar that’s gone by the close.
✅ Do this: Use Calculate.OnBarClose for confirmed-bar signals. If you switch to tick updates, label the output clearly as intrabar and test it in real-time playback.
Pro tips for turning the basic build into a useful chart tool
Match your guard to your longest lookback. Add an EMA 200 trend filter later? Use if (CurrentBar < 200) return;, not the original 21-bar guard. This prevents a filter from reading incomplete values.
Keep signal tags unique. The CurrentBar suffix means every arrow has an identity. If the same static tag is used for all bullish crosses, NinjaTrader updates one drawing object instead of preserving historical signals.
Add one filter at a time. For example, require the close to be above a 200 EMA for bullish arrows. Compile, reload the chart, and compare the arrow count before adding an RSI threshold. That sequence makes debugging possible.
Use alerts after the visual test. First verify the plotted averages and arrows on historical bars. Then create an alert condition for the EMA relationship. This prevents you from troubleshooting alerts when the underlying indicator logic is wrong.
Don’t confuse a plotted crossover with a trade plan. The signal identifies a state transition. A trade plan still needs session rules, entry timing, invalidation, sizing, and an exit rule. If you’re validating those rules, backtesting metrics explained gives you the vocabulary to inspect the result instead of judging it from a few chart examples.
Generating this indicator without writing the code yourself
You can build the same artifact in HorizonAI by describing the indicator precisely. HorizonAI generates NinjaScript indicators from plain-English chat, compiles the code, and lets you edit the result in the conversation or its browser editor. It writes the code; you compile it in NinjaTrader and decide how, or whether, to use it on a chart.
Create a NinjaTrader 8 NinjaScript indicator named EmaCrossoverSignals. Overlay it on price. Add user inputs FastPeriod default 9, SlowPeriod default 21, and ColorPlotsByTrend default true. Plot both EMAs. In OnBarUpdate, wait until SlowPeriod bars exist, assign the EMA values to plots, color both plots lime green when fast EMA is at or above slow EMA and red otherwise. Draw one lime-green up arrow 2 ticks below the low when the fast EMA crosses above the slow EMA, and one red down arrow 2 ticks above the high when it crosses below. Use Calculate.OnBarClose and include the required using statements.
If you already have a rough script, use a tighter edit request:
Edit this NinjaScript indicator: add a boolean ShowArrows input that defaults to true, and only execute the Draw.ArrowUp and Draw.ArrowDown calls when ShowArrows is enabled. Keep all existing plots and inputs unchanged.
The result is compile-checked NinjaScript you can inspect and revise before pasting into NinjaTrader. Try it free →
FAQs
How do I create an indicator in NinjaTrader 8 without learning all of C#?
Use the NinjaScript Editor to create an Indicator script, then start from a complete working class and change one input or condition at a time. You still need to understand what the indicator calculates, but you don’t need to memorize the entire framework before building something useful.
Why does my custom NinjaTrader indicator not show in the Indicators list?
Compile it first with F5 and read the Error tab. Check that the public class is inside the NinjaTrader.NinjaScript.Indicators namespace and that its name matches the script file you created.
Should an EMA crossover indicator calculate on each tick or on bar close?
Use bar close when you want signals confirmed by a completed candle. Use each tick only when you accept that an open-bar crossover can appear and disappear before the candle closes.
Can this indicator place trades automatically?
No. This indicator only plots values and arrows. A NinjaTrader strategy is the script type that contains order-entry and position-management logic.
Final thoughts
A custom NinjaTrader indicator becomes manageable once you separate its jobs: declare settings and plots in OnStateChange(), create supporting indicators when data loads, and calculate or draw in OnBarUpdate(). The 9/21 crossover is deliberately simple, which makes it a dependable foundation for more selective conditions.
One concrete next step: add a 200 EMA filter, then only draw bullish cross arrows when Close[0] > EMA(200)[0]. Make that modification in isolation and compare the chart before you add any second filter.
Related articles
- NinjaScript Tutorial: Code Your First NinjaTrader 8 Strategy — Turn chart conditions into a strategy with explicit orders and exits.
- How to Build a Multi-Timeframe Strategy in NinjaScript — Add higher-timeframe context once single-series logic is stable.
- Build an Opening Range Breakout Indicator in NinjaScript — A focused intraday indicator build with session logic.
- How to Convert Pine Script to NinjaScript for NinjaTrader 8 — Translate an existing TradingView concept into NinjaTrader syntax.
- Simple Moving Average Crossover Strategy: Complete Guide — Compare crossover logic before adding execution rules.
- EMA vs SMA — Which Moving Average is Better for Trading? — Choose moving-average behavior that matches your chart purpose.
- How to Build a Momentum Indicator in Pine Script v6 — Add a second confirmation layer without hiding the logic.
- How to Backtest Trading Strategies Like a Pro — Test rule-based ideas with a repeatable process.
Questions about custom NinjaTrader indicators? Join our Discord to discuss with other traders!